Advanced Micro Devices is a semiconductor company. Co.'s segment are: Computing and Graphics, which primarily includes desktop and notebook microprocessors, accelerated processing units that integrate microprocessors and graphics, chipsets, discrete graphics processing units (GPUs), data center and GPUs, and development services; and Enterprise, Embedded and Semi-Custom, which primarily includes server and embedded processors, semi-custom system-on-chip products, development services and technology for game consoles. In addition, Co. sells or licenses portions of its intellectual property portfolio.
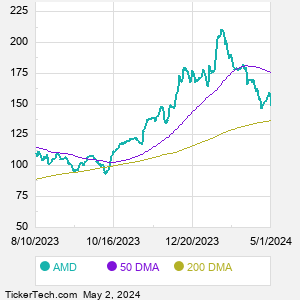
When researching a stock like Advanced Micro Devices, many investors are the most familiar with Fundamental Analysis — looking at a company's balance sheet, earnings, revenues, and what's happening in that company's underlying business. Investors who use Fundamental Analysis to identify good stocks to buy or sell can also benefit from AMD Technical Analysis to help find a good entry or exit point. Technical Analysis is blind to the fundamentals and looks only at the trading data for AMD stock — the real life supply and demand for the stock over time — and examines that data in different ways. One of these ways is called the Relative Strength Index, or RSI. This popular indicator, originally developed in the 1970's by J. Welles Wilder, looks at a 14-day moving average of a stock's gains on its up days, versus its losses on its down days. The resulting AMD RSI is a value that measures momentum, oscillating between "oversold" and "overbought" on a scale of zero to 100. A reading below 30 is viewed to be oversold, which a bullish investor could look to as a sign that the selling is in the process of exhausting itself, and look for entry point opportunities. A reading above 70 is viewed to be overbought, which could indicate that a rally in progress is starting to get crowded with buyers. If the rally has been a long one, that could be a sign that a pullback is overdue. |