Cisco Systems designs and sells technologies that power the Internet. Co.'s products and technologies include: Secure, Agile Networks, which consists of networking technologies of switching, enterprise routing, wireless, and compute products; Internet for the Future, which consists of routed optical networking, 5G, silicon and optics solutions; Collaboration, which consists of Meetings, Collaboration Devices, Calling, Contact Center and Communication Platform as a Service offerings; End-to-End Security, which consists of its Cloud and Application Security, Industrial Security, Network Security, and User and Device Security offerings; Optimized Application Experiences; and Other Products.
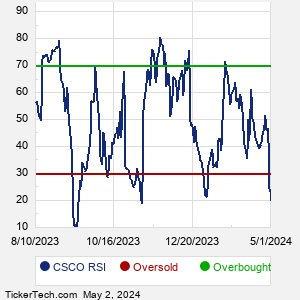
When researching a stock like Cisco Systems, many investors are the most familiar with Fundamental Analysis — looking at a company's balance sheet, earnings, revenues, and what's happening in that company's underlying business. Investors who use Fundamental Analysis to identify good stocks to buy or sell can also benefit from CSCO Technical Analysis to help find a good entry or exit point. Technical Analysis is blind to the fundamentals and looks only at the trading data for CSCO stock — the real life supply and demand for the stock over time — and examines that data in different ways. One of these ways is called the Relative Strength Index, or RSI. This popular indicator, originally developed in the 1970's by J. Welles Wilder, looks at a 14-day moving average of a stock's gains on its up days, versus its losses on its down days. The resulting CSCO RSI is a value that measures momentum, oscillating between "oversold" and "overbought" on a scale of zero to 100. A reading below 30 is viewed to be oversold, which a bullish investor could look to as a sign that the selling is in the process of exhausting itself, and look for entry point opportunities. A reading above 70 is viewed to be overbought, which could indicate that a rally in progress is starting to get crowded with buyers. If the rally has been a long one, that could be a sign that a pullback is overdue. |