Salesforce is engaged in customer relationship management technology. Co.'s Customer 360 service offerings include: Sales, which enables sales teams of companies to manage and automate their sales process; Service, which enables companies to deliver customer service and support; Platform, which enables companies to build business apps; Marketing, which enables companies to plan, personalize and optimize one-to-one customer marketing journeys; Commerce, which enables brands to unify the customer experience; Analytics, which provides customers an end-to-end analytics solution serving a range of enterprise use cases; and Integration, which connects data from various system.
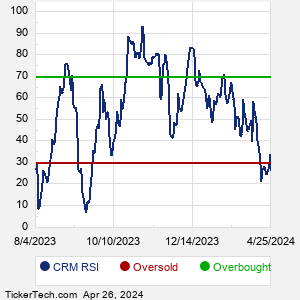
When researching a stock like Salesforce.com, many investors are the most familiar with Fundamental Analysis — looking at a company's balance sheet, earnings, revenues, and what's happening in that company's underlying business. Investors who use Fundamental Analysis to identify good stocks to buy or sell can also benefit from CRM Technical Analysis to help find a good entry or exit point. Technical Analysis is blind to the fundamentals and looks only at the trading data for CRM stock — the real life supply and demand for the stock over time — and examines that data in different ways. One of these ways is called the Relative Strength Index, or RSI. This popular indicator, originally developed in the 1970's by J. Welles Wilder, looks at a 14-day moving average of a stock's gains on its up days, versus its losses on its down days. The resulting CRM RSI is a value that measures momentum, oscillating between "oversold" and "overbought" on a scale of zero to 100. A reading below 30 is viewed to be oversold, which a bullish investor could look to as a sign that the selling is in the process of exhausting itself, and look for entry point opportunities. A reading above 70 is viewed to be overbought, which could indicate that a rally in progress is starting to get crowded with buyers. If the rally has been a long one, that could be a sign that a pullback is overdue. |