Electronic Arts develops, markets, publishes and delivers games, content and services that can be experienced on game consoles, PCs, mobile phones and tablets. Co.'s portfolio includes brands that Co. either wholly owns (such as Apex Legends, Battlefield, and The Sims) or licenses from others (such as Madden NFL, Star Wars, and the 300+ licenses within Co.'s global football ecosystem). Co. develops and publishes games and services across diverse genres, such as sports, racing, first-person shooter, action, role-playing and simulation. Co. also provides its EA Play subscription service on consoles and PC. Co.'s packaged goods games are sold to market retailers.
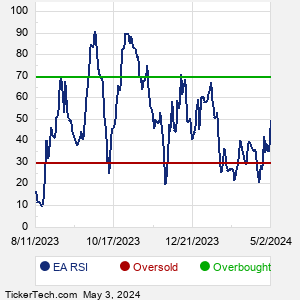
When researching a stock like Electronic Arts, many investors are the most familiar with Fundamental Analysis — looking at a company's balance sheet, earnings, revenues, and what's happening in that company's underlying business. Investors who use Fundamental Analysis to identify good stocks to buy or sell can also benefit from EA Technical Analysis to help find a good entry or exit point. Technical Analysis is blind to the fundamentals and looks only at the trading data for EA stock — the real life supply and demand for the stock over time — and examines that data in different ways. One of these ways is called the Relative Strength Index, or RSI. This popular indicator, originally developed in the 1970's by J. Welles Wilder, looks at a 14-day moving average of a stock's gains on its up days, versus its losses on its down days. The resulting EA RSI is a value that measures momentum, oscillating between "oversold" and "overbought" on a scale of zero to 100. A reading below 30 is viewed to be oversold, which a bullish investor could look to as a sign that the selling is in the process of exhausting itself, and look for entry point opportunities. A reading above 70 is viewed to be overbought, which could indicate that a rally in progress is starting to get crowded with buyers. If the rally has been a long one, that could be a sign that a pullback is overdue. |