CAG RSI: Conagra Brands Relative Strength Index

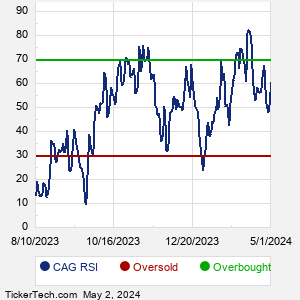
CAG RSI is 57.59 as of 7/14/2026, with Conagra Brands trading at 14.15. The Relative Strength Index compares recent gains and losses to help identify overbought or oversold momentum. Traditional RSI thresholds often view readings below 30 as oversold and readings above 70 as overbought.

CAG RSI: Conagra Brands Relative Strength Index Chart


As of date:7/14/2026
CAG stock price:14.15
CAG RSI:57.59
Extremely
Overbought
Overbought/Oversold RSI Range
RSI Indicator (Relative Strength Index)57.59
Extremely
Oversold

Also see:
CAG Market Cap History
CAG Shares Outstanding History
CAG YTD Return
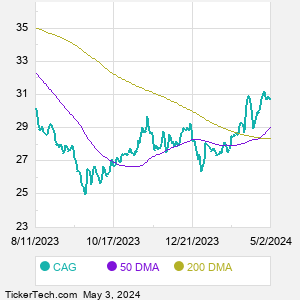
CAG DMA
CAG MACD
CAG Technical Analysis

Ichor Holdings Stock Tops Average Analyst Target as ICHR Valuation Debate Intensifies
3 hours, 36 minutes ago


TELUS Shares Enter Oversold Territory as RSI Falls Below 30
19 hours, 3 minutes ago


Sable Offshore Stock Enters Oversold Territory as RSI Falls Below 30
19 hours, 5 minutes ago


TELUS Stock Enters Oversold Territory as Dividend Yield Rises
19 hours, 46 minutes ago


Ellomay Capital Stock Enters Oversold Territory as RSI Falls Below 30
19 hours, 49 minutes ago


Healthcare and Consumer Products Lead Tuesday Sector Declines as XLV and IYK Slip
20 hours, 24 minutes ago


Brookfield Renewable Enters Oversold Territory as RSI Falls Below 30
Monday, July 13, 4:37 PM


Destiny Tech100 (DXYZ) Enters Oversold Territory as RSI Falls Below 30
Monday, July 13, 4:32 PM


KraneShares MSCI China Clean Technology ETF Enters Oversold Territory as RSI Falls Below 30
Monday, July 13, 4:32 PM


Shares of BEPC Now Oversold
Monday, July 13, 4:03 PM


OR Royalties Stock Enters Oversold Territory as RSI Drops Below 30
Monday, July 13, 4:02 PM


Dolby Laboratories Stock Enters Oversold Territory as Dividend Yield Improves
Monday, July 13, 4:01 PM


Apollo Series A Preferred Yield Tops 5.5% as Shares Trade Above Liquidation Preference
Monday, July 13, 2:51 PM


Invesco NASDAQ 100 ETF (QQQM) Draws Strong Inflows as Assets Track Nasdaq-100 Demand
Monday, July 13, 12:22 PM


Shift4 Payments Preferred Stock Ex-Dividend Date Nears as FOUR.PRA Offers Elevated Yield
Monday, July 13, 12:20 PM


More Technical Analysis News

CAG RSICAG DMA
Conagra Brands, Inc. is a consumer-packaged goods food company with several segments: Grocery & Snacks, which includes branded, shelf-stable food products sold in U.S. retail channels; Refrigerated & Frozen, featuring branded, temperature-controlled food products sold in U.S. retail channels; International, which includes branded food products in various temperature states sold in retail and foodservice channels outside the U.S.; and Foodservice, offering branded and customized food products for restaurants and foodservice establishments in the U.S. Its brands include Birds Eye, Duncan Hines, Healthy Choice, Marie Callender's, Reddi-wip, BOOMCHICKAPOP, and FATTY Smoked Meat Sticks.

When researching a stock like Conagra Brands, many investors are the most familiar with Fundamental Analysis — looking at a company's balance sheet, earnings, revenues, and what's happening in that company's underlying business. Investors who use Fundamental Analysis to identify good stocks to buy or sell can also benefit from CAG Technical Analysis to help find a good entry or exit point. Technical Analysis is blind to the fundamentals and looks only at the trading data for CAG stock — the real life supply and demand for the stock over time — and examines that data in different ways. One of these ways is called the Relative Strength Index, or RSI. This popular indicator, originally developed in the 1970's by J. Welles Wilder, looks at a 14-day moving average of a stock's gains on its up days, versus its losses on its down days. The resulting CAG RSI is a value that measures momentum, oscillating between "oversold" and "overbought" on a scale of zero to 100. A reading below 30 is viewed to be oversold, which a bullish investor could look to as a sign that the selling is in the process of exhausting itself, and look for entry point opportunities. A reading above 70 is viewed to be overbought, which could indicate that a rally in progress is starting to get crowded with buyers. If the rally has been a long one, that could be a sign that a pullback is overdue.
10 Most Oversold S&P 500 Stocks
10 Most Overbought S&P 500 Stocks

10 ETFs With Stocks Insiders Are Buying
10 ETFs With Most Upside To Targets
The DividendRank Top 25
Warren Buffett Dividend Stocks
10 Cheap Dividend Stocks Under $10
10 Top DividendRank'ed Energy Stocks
The 10 Highest Yielding Preferred Stocks
The 15 Most Active S&P Call & Put Options
Quotes delayed 20 minutes

Email EnvelopeFree CAG Email Alerts:
Get Dividend Alerts
Get SEC Filing Alerts
Video: RSI Indicator
Conagra Brands (CAG) is categorized under the Consumer sector; to help you further research RSI, below are some other companies in the same sector:

CHD RSI
CL RSI
CLX RSI
CMI RSI
DECK RSI
EL RSI
F RSI
GIS RSI
GM RSI
GPC RSI
More Consumer companies »
 

CAG RSI: Conagra Brands Relative Strength Index Chart | www.StockRSI.com | Copyright © 2019 - 2026, All Rights Reserved

Nothing in StockRSI.com is intended to be investment advice, nor does it represent the opinion of, counsel from, or recommendations by BNK Invest Inc. or any of its affiliates, subsidiaries or partners. None of the information contained herein constitutes a recommendation that any particular security, portfolio, transaction, or investment strategy is suitable for any specific person. All viewers agree that under no circumstances will BNK Invest, Inc,. its subsidiaries, partners, officers, employees, affiliates, or agents be held liable for any loss or damage caused by your reliance on information obtained. By visiting, using or viewing this site, you agree to the following Full Disclaimer & Terms of Use and Privacy Policy. Video widget and market videos powered by Market News Video. Quote and option data delayed at least 15 minutes; stock quote data powered by Ticker Technologies, and Mergent.
X
Wait! Don't leave yet.
Want to receive our latest research absolutely free?


Click the button below for your complimentary copy of Your Early Retirement Portfolio: Dividends Up to 8.7%—Every Month—Forever.

You'll discover the details on 4 stocks and funds that pay you massive dividends as high as 8.7%.