Ford Motor develops and delivers Ford trucks, sport utility vehicles, commercial vans and cars, and Lincoln luxury vehicles, along with connected services. Additionally, Co. provides financial services through its subsidiary, Ford Motor Credit Company LLC (Ford Credit). Co.'s segments are: Automotive, which includes the sale of Ford and Lincoln vehicles, service parts, and accessories; Mobility, which includes development costs for its autonomous vehicles and related businesses, its equity ownership in Argo AI, LLC, and other mobility businesses and investments; and Ford Credit, which includes the business on a consolidated basis, that is vehicle-related financing and leasing activities.
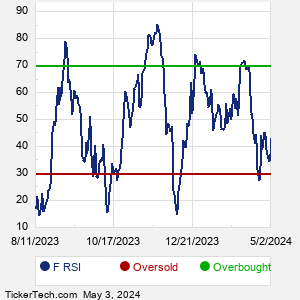
When researching a stock like Ford Motor, many investors are the most familiar with Fundamental Analysis — looking at a company's balance sheet, earnings, revenues, and what's happening in that company's underlying business. Investors who use Fundamental Analysis to identify good stocks to buy or sell can also benefit from F Technical Analysis to help find a good entry or exit point. Technical Analysis is blind to the fundamentals and looks only at the trading data for F stock — the real life supply and demand for the stock over time — and examines that data in different ways. One of these ways is called the Relative Strength Index, or RSI. This popular indicator, originally developed in the 1970's by J. Welles Wilder, looks at a 14-day moving average of a stock's gains on its up days, versus its losses on its down days. The resulting F RSI is a value that measures momentum, oscillating between "oversold" and "overbought" on a scale of zero to 100. A reading below 30 is viewed to be oversold, which a bullish investor could look to as a sign that the selling is in the process of exhausting itself, and look for entry point opportunities. A reading above 70 is viewed to be overbought, which could indicate that a rally in progress is starting to get crowded with buyers. If the rally has been a long one, that could be a sign that a pullback is overdue. |