General Mills is a manufacturer and marketer of branded consumer foods. Co.'s business is focused on snacks, ready-to-eat cereal, convenient meals, wholesome natural pet food, refrigerated and frozen dough, baking mixes and ingredients, yogurt, and ice cream categories. Co.'s segments include: North America Retail, which reflects business with a variety of grocery stores, mass merchandisers, membership stores, natural food chains, drug, dollar and discount chains, convenience stores, and e-commerce grocery providers; International, which reflects retail and foodservice business outside of the U.S. and Canada; and Pet, which includes pet food products sold primarily in the U.S. and Canada.
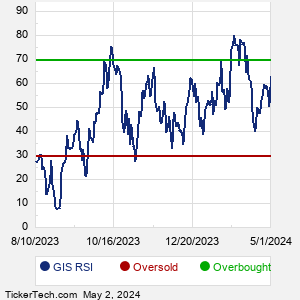
When researching a stock like General Mills, many investors are the most familiar with Fundamental Analysis — looking at a company's balance sheet, earnings, revenues, and what's happening in that company's underlying business. Investors who use Fundamental Analysis to identify good stocks to buy or sell can also benefit from GIS Technical Analysis to help find a good entry or exit point. Technical Analysis is blind to the fundamentals and looks only at the trading data for GIS stock — the real life supply and demand for the stock over time — and examines that data in different ways. One of these ways is called the Relative Strength Index, or RSI. This popular indicator, originally developed in the 1970's by J. Welles Wilder, looks at a 14-day moving average of a stock's gains on its up days, versus its losses on its down days. The resulting GIS RSI is a value that measures momentum, oscillating between "oversold" and "overbought" on a scale of zero to 100. A reading below 30 is viewed to be oversold, which a bullish investor could look to as a sign that the selling is in the process of exhausting itself, and look for entry point opportunities. A reading above 70 is viewed to be overbought, which could indicate that a rally in progress is starting to get crowded with buyers. If the rally has been a long one, that could be a sign that a pullback is overdue. |