General Motors designs, builds and sells trucks, crossovers, cars and automobile parts and provides software-enabled services and subscriptions worldwide. Co.'s automotive segments include: GM North America and GM International. Cruise is Co.'s global segment responsible for the development and commercialization of autonomous vehicle technology. Co. provides automotive financing services through its subsidiary, General Motors Financial Company, Inc. (GM Financial) segment. GM Financial provides retail loan and lease lending across the credit spectrum. Additionally, GM Financial provides commercial lending products to dealers including floorplan financing and dealer loans.
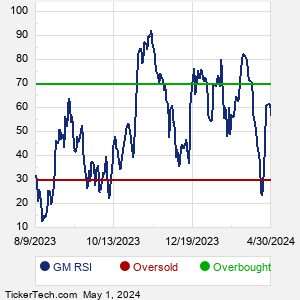
When researching a stock like General Motors, many investors are the most familiar with Fundamental Analysis — looking at a company's balance sheet, earnings, revenues, and what's happening in that company's underlying business. Investors who use Fundamental Analysis to identify good stocks to buy or sell can also benefit from GM Technical Analysis to help find a good entry or exit point. Technical Analysis is blind to the fundamentals and looks only at the trading data for GM stock — the real life supply and demand for the stock over time — and examines that data in different ways. One of these ways is called the Relative Strength Index, or RSI. This popular indicator, originally developed in the 1970's by J. Welles Wilder, looks at a 14-day moving average of a stock's gains on its up days, versus its losses on its down days. The resulting GM RSI is a value that measures momentum, oscillating between "oversold" and "overbought" on a scale of zero to 100. A reading below 30 is viewed to be oversold, which a bullish investor could look to as a sign that the selling is in the process of exhausting itself, and look for entry point opportunities. A reading above 70 is viewed to be overbought, which could indicate that a rally in progress is starting to get crowded with buyers. If the rally has been a long one, that could be a sign that a pullback is overdue. |