Fortive is a provider of technologies for connected workflow solutions across a range of end-markets. Co.'s segments include: Intelligent Operating Solutions, which provides workflow solutions to accelerate industrial and facility reliability and performance, as well as compliance and safety across a range of vertical end markets; Precision Technologies, which supplies instrumentation and sensing technologies to a set of vertical end markets, enabling its customers to accelerate the development, manufacture and launch of products and solutions; and Advanced Healthcare Solutions, which supplies workflow solutions to hospitals and other healthcare customers.
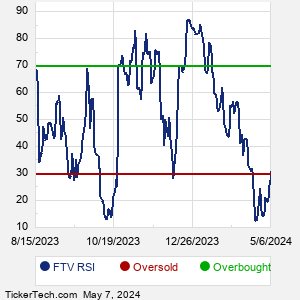
When researching a stock like Fortive, many investors are the most familiar with Fundamental Analysis — looking at a company's balance sheet, earnings, revenues, and what's happening in that company's underlying business. Investors who use Fundamental Analysis to identify good stocks to buy or sell can also benefit from FTV Technical Analysis to help find a good entry or exit point. Technical Analysis is blind to the fundamentals and looks only at the trading data for FTV stock — the real life supply and demand for the stock over time — and examines that data in different ways. One of these ways is called the Relative Strength Index, or RSI. This popular indicator, originally developed in the 1970's by J. Welles Wilder, looks at a 14-day moving average of a stock's gains on its up days, versus its losses on its down days. The resulting FTV RSI is a value that measures momentum, oscillating between "oversold" and "overbought" on a scale of zero to 100. A reading below 30 is viewed to be oversold, which a bullish investor could look to as a sign that the selling is in the process of exhausting itself, and look for entry point opportunities. A reading above 70 is viewed to be overbought, which could indicate that a rally in progress is starting to get crowded with buyers. If the rally has been a long one, that could be a sign that a pullback is overdue. |