Corning provides glass for notebook computers, flat panel desktop monitors, display televisions, and other information display applications; carrier network and enterprise network products for the telecommunications industry; ceramic substrates for gasoline and diesel engines in automotive and heavy-duty vehicle markets; laboratory products for the scientific community and polymer products for biotechnology applications; optical materials for the semiconductor industry and the scientific community; and polycrystalline silicon products and other technologies. Co.'s segments are: Display Technologies, Optical Communications, Specialty Materials, Environmental Technologies and Life Sciences.
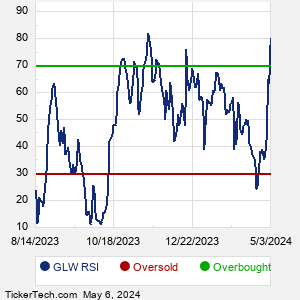
When researching a stock like Corning, many investors are the most familiar with Fundamental Analysis — looking at a company's balance sheet, earnings, revenues, and what's happening in that company's underlying business. Investors who use Fundamental Analysis to identify good stocks to buy or sell can also benefit from GLW Technical Analysis to help find a good entry or exit point. Technical Analysis is blind to the fundamentals and looks only at the trading data for GLW stock — the real life supply and demand for the stock over time — and examines that data in different ways. One of these ways is called the Relative Strength Index, or RSI. This popular indicator, originally developed in the 1970's by J. Welles Wilder, looks at a 14-day moving average of a stock's gains on its up days, versus its losses on its down days. The resulting GLW RSI is a value that measures momentum, oscillating between "oversold" and "overbought" on a scale of zero to 100. A reading below 30 is viewed to be oversold, which a bullish investor could look to as a sign that the selling is in the process of exhausting itself, and look for entry point opportunities. A reading above 70 is viewed to be overbought, which could indicate that a rally in progress is starting to get crowded with buyers. If the rally has been a long one, that could be a sign that a pullback is overdue. |