FactSet Research Systems is a global financial data and analytics company. Co.'s platform delivers data, analytics, and technology that financial personnel need in their investment workflows. Several asset managers, bankers, wealth managers, asset owners, channel partners, hedge funds, corporate users, private equity and venture capital personnel, use Co.'s solutions in investment research, portfolio construction and analysis, trade execution, performance measurement, risk management, and reporting. Co. executes its strategy through its three workflow solutions: Research and Advisory; Analytics and Trading; and Content and Technology.
When researching a stock like FactSet Research Systems, many investors are the most familiar with Fundamental Analysis — looking at a company's balance sheet, earnings, revenues, and what's happening in that company's underlying business. Investors who use Fundamental Analysis to identify good stocks to buy or sell can also benefit from FDS Technical Analysis to help find a good entry or exit point. Technical Analysis is blind to the fundamentals and looks only at the trading data for FDS stock — the real life supply and demand for the stock over time — and examines that data in different ways. One of these ways is called the Relative Strength Index, or RSI. This popular indicator, originally developed in the 1970's by J. Welles Wilder, looks at a 14-day moving average of a stock's gains on its up days, versus its losses on its down days. The resulting FDS RSI is a value that measures momentum, oscillating between "oversold" and "overbought" on a scale of zero to 100. A reading below 30 is viewed to be oversold, which a bullish investor could look to as a sign that the selling is in the process of exhausting itself, and look for entry point opportunities. A reading above 70 is viewed to be overbought, which could indicate that a rally in progress is starting to get crowded with buyers. If the rally has been a long one, that could be a sign that a pullback is overdue. |


 38.55
38.55



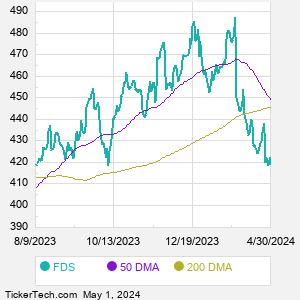
 Free FDS Email Alerts:


 Video: RSI Indicator