Fortinet provides cybersecurity solutions to a variety of organizations, including enterprises, communication service providers, government organizations and small to medium-sized enterprises. Co.'s cybersecurity solutions are designed to provide visibility and segmentation of the digital attack surface through its Fortinet Security Fabric platform, which features automated protection, detection and response. Co.'s main product offerings consist of its FortiGate firewall product family and its non-FortiGate products. Co.'s non-FortiGate products include the Fortinet Security Fabric cybersecurity mesh platform, email security, cloud security, endpoint protection and other products.
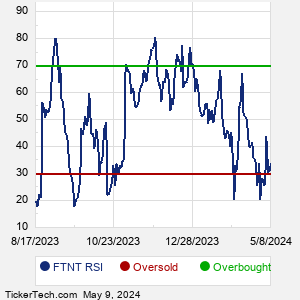
When researching a stock like Fortinet, many investors are the most familiar with Fundamental Analysis — looking at a company's balance sheet, earnings, revenues, and what's happening in that company's underlying business. Investors who use Fundamental Analysis to identify good stocks to buy or sell can also benefit from FTNT Technical Analysis to help find a good entry or exit point. Technical Analysis is blind to the fundamentals and looks only at the trading data for FTNT stock — the real life supply and demand for the stock over time — and examines that data in different ways. One of these ways is called the Relative Strength Index, or RSI. This popular indicator, originally developed in the 1970's by J. Welles Wilder, looks at a 14-day moving average of a stock's gains on its up days, versus its losses on its down days. The resulting FTNT RSI is a value that measures momentum, oscillating between "oversold" and "overbought" on a scale of zero to 100. A reading below 30 is viewed to be oversold, which a bullish investor could look to as a sign that the selling is in the process of exhausting itself, and look for entry point opportunities. A reading above 70 is viewed to be overbought, which could indicate that a rally in progress is starting to get crowded with buyers. If the rally has been a long one, that could be a sign that a pullback is overdue. |