Intel provides end-to-end solutions, scaling from edge computing to 5G networks, the cloud, and the emerging fields of Artificial intelligence and autonomous driving. Co.'s segments are: Client Computing Group, which focuses on long-term operating system, system architecture, hardware, and application integration; Data Center Group and AI, which delivers workload-optimized solutions; Network and Edge, which delivers and deploys intelligent edge platforms; Mobileye, which provides driving assistance and self-driving solutions; Accelerated Computing Systems and Graphics, which solves the computational problems; and Intel Foundry Services.
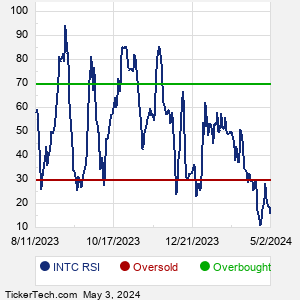
When researching a stock like Intel, many investors are the most familiar with Fundamental Analysis — looking at a company's balance sheet, earnings, revenues, and what's happening in that company's underlying business. Investors who use Fundamental Analysis to identify good stocks to buy or sell can also benefit from INTC Technical Analysis to help find a good entry or exit point. Technical Analysis is blind to the fundamentals and looks only at the trading data for INTC stock — the real life supply and demand for the stock over time — and examines that data in different ways. One of these ways is called the Relative Strength Index, or RSI. This popular indicator, originally developed in the 1970's by J. Welles Wilder, looks at a 14-day moving average of a stock's gains on its up days, versus its losses on its down days. The resulting INTC RSI is a value that measures momentum, oscillating between "oversold" and "overbought" on a scale of zero to 100. A reading below 30 is viewed to be oversold, which a bullish investor could look to as a sign that the selling is in the process of exhausting itself, and look for entry point opportunities. A reading above 70 is viewed to be overbought, which could indicate that a rally in progress is starting to get crowded with buyers. If the rally has been a long one, that could be a sign that a pullback is overdue. |