BBY RSI


As of date:12/10/2025
BBY stock price:74.12
BBY RSI:49.34
Extremely
Overbought
Overbought/Oversold RSI Range
RSI Indicator (Relative Strength Index)49.34
Extremely
Oversold

Also see:
BBY Market Cap History
BBY Shares Outstanding History
BBY YTD Return
BBY DMA
BBY MACD
BBY Technical Analysis

Gran Tierra Energy Breaks Below 200-Day Moving Average - Notable for GTE.CA
3 minutes ago


MTN Crosses Above Key Moving Average Level
2 hours, 43 minutes ago


KFY Makes Bullish Cross Above Critical Moving Average
2 hours, 43 minutes ago


SMIG Makes Bullish Cross Above Critical Moving Average
2 hours, 43 minutes ago


OLN Crosses Above Key Moving Average Level
2 hours, 55 minutes ago


ProShares UltraShort Bloomberg Natural Gas (KOLD) Shares Cross Above 200 DMA
3 hours, 2 minutes ago


RS Crosses Above Key Moving Average Level
3 hours, 8 minutes ago


TerraVest Industries Breaks Above 200-Day Moving Average - Bullish for TVK.CA
3 hours, 8 minutes ago


Touchstone Strategic Income Opportunities (SIO) Shares Cross Below 200 DMA
3 hours, 12 minutes ago


Bullish Two Hundred Day Moving Average Cross - TUA
3 hours, 12 minutes ago


PAXS Makes Notable Cross Below Critical Moving Average
3 hours, 14 minutes ago


Invesco High Yield Equity Dividend Achievers Breaks Above 200-Day Moving Average - Bullish for PEY
3 hours, 15 minutes ago


Youdao Breaks Below 200-Day Moving Average - Notable for DAO
3 hours, 15 minutes ago


SIO Crosses Critical Technical Indicator
3 hours, 15 minutes ago


VictoryShares Short-Term Bond Breaks Below 200-Day Moving Average - Notable for USTB
3 hours, 15 minutes ago


More Technical Analysis News

BBY RSIBBY DMA
Best Buy Co., Inc. is engaged in personalizing and humanizing technology solutions. Co. operates through two segments: Domestic and International. Domestic segment is comprised of its operations in all states, districts and territories of the U.S. and its Best Buy Health business, and includes the brand names Best Buy, Best Buy Ads, Best Buy Business, Best Buy Health, CST, Current Health, Geek Squad, Lively, Magnolia, Pacific Kitchen and Home, TechLiquidators and Yardbird and the domain names bestbuy.com, currenthealth.com, lively.com, techliquidators.com and yardbird.com.

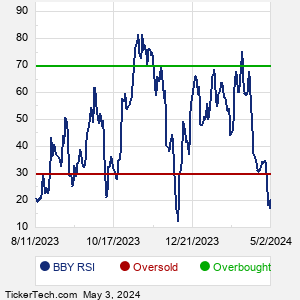
When researching a stock like Best Buy, many investors are the most familiar with Fundamental Analysis — looking at a company's balance sheet, earnings, revenues, and what's happening in that company's underlying business. Investors who use Fundamental Analysis to identify good stocks to buy or sell can also benefit from BBY Technical Analysis to help find a good entry or exit point. Technical Analysis is blind to the fundamentals and looks only at the trading data for BBY stock — the real life supply and demand for the stock over time — and examines that data in different ways. One of these ways is called the Relative Strength Index, or RSI. This popular indicator, originally developed in the 1970's by J. Welles Wilder, looks at a 14-day moving average of a stock's gains on its up days, versus its losses on its down days. The resulting BBY RSI is a value that measures momentum, oscillating between "oversold" and "overbought" on a scale of zero to 100. A reading below 30 is viewed to be oversold, which a bullish investor could look to as a sign that the selling is in the process of exhausting itself, and look for entry point opportunities. A reading above 70 is viewed to be overbought, which could indicate that a rally in progress is starting to get crowded with buyers. If the rally has been a long one, that could be a sign that a pullback is overdue.
10 Most Oversold S&P 500 Stocks
10 Most Overbought S&P 500 Stocks

10 ETFs With Stocks Insiders Are Buying
10 ETFs With Most Upside To Targets
The DividendRank Top 25
Warren Buffett Dividend Stocks
10 Cheap Dividend Stocks Under $10
10 Top DividendRank'ed Energy Stocks
The 10 Highest Yielding Preferred Stocks
The 15 Most Active S&P Call & Put Options
Quotes delayed 20 minutes

Email EnvelopeFree BBY Email Alerts:
Get Dividend Alerts
Get SEC Filing Alerts
Video: RSI Indicator


If the video does not load after a few moments, Upgrade to the Latest Flash Player.
Best Buy (BBY) is categorized under the Services sector; to help you further research RSI, below are some other companies in the same sector:

BKNG RSI
CCL RSI
CHTR RSI
CMCSA RSI
CMG RSI
COST RSI
DASH RSI
DG RSI
DHI RSI
DIS RSI
More Services companies »


BBY RSI | www.StockRSI.com | Copyright © 2019 - 2025, All Rights Reserved

Nothing in StockRSI.com is intended to be investment advice, nor does it represent the opinion of, counsel from, or recommendations by BNK Invest Inc. or any of its affiliates, subsidiaries or partners. None of the information contained herein constitutes a recommendation that any particular security, portfolio, transaction, or investment strategy is suitable for any specific person. All viewers agree that under no circumstances will BNK Invest, Inc,. its subsidiaries, partners, officers, employees, affiliates, or agents be held liable for any loss or damage caused by your reliance on information obtained. By visiting, using or viewing this site, you agree to the following Full Disclaimer & Terms of Use and Privacy Policy. Video widget and market videos powered by Market News Video. Quote and option data delayed at least 15 minutes; stock quote data powered by Ticker Technologies, and Mergent.
X
Wait! Don't leave yet.
Want to receive our latest research absolutely free?


Click the button below for your complimentary copy of Your Early Retirement Portfolio: Dividends Up to 7.6%—Every Month—Forever.

You'll discover the details on 4 stocks and funds that pay you massive dividends as high as 7.6%.