Comcast is a media and technology company. Co.'s cable communications segment provides broadband, video, voice, wireless, and other services under the Xfinity brand; Co. also provides these and other services to business customers and sell advertising. Co. markets its services to residential and business customers individually and as bundled services. Co.'s NBCUniversal segment develops, produces and distributes entertainment, news and information, sports, and other content for global audiences, and owns and operates theme parks in the U.S. and Asia. Co.'s Sky segment provides broadband, voice and wireless services individually and as bundled services in select countries.
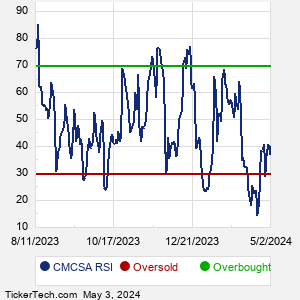
When researching a stock like Comcast, many investors are the most familiar with Fundamental Analysis — looking at a company's balance sheet, earnings, revenues, and what's happening in that company's underlying business. Investors who use Fundamental Analysis to identify good stocks to buy or sell can also benefit from CMCSA Technical Analysis to help find a good entry or exit point. Technical Analysis is blind to the fundamentals and looks only at the trading data for CMCSA stock — the real life supply and demand for the stock over time — and examines that data in different ways. One of these ways is called the Relative Strength Index, or RSI. This popular indicator, originally developed in the 1970's by J. Welles Wilder, looks at a 14-day moving average of a stock's gains on its up days, versus its losses on its down days. The resulting CMCSA RSI is a value that measures momentum, oscillating between "oversold" and "overbought" on a scale of zero to 100. A reading below 30 is viewed to be oversold, which a bullish investor could look to as a sign that the selling is in the process of exhausting itself, and look for entry point opportunities. A reading above 70 is viewed to be overbought, which could indicate that a rally in progress is starting to get crowded with buyers. If the rally has been a long one, that could be a sign that a pullback is overdue. |