Walt Disney, together with its subsidiaries, is an entertainment company with operations in two segments: Disney Media and Entertainment Distribution (DMED) and Disney Parks, Experiences and Products (DPEP). DMED encompasses Co.'s film and episodic television content production and distribution activities. Content is distributed by a single organization across three lines of business: Linear Networks, Direct-to-Consumer and Content Sales/Licensing. The operations of DPEP's lines of business are: Parks and Experiences, which consist of theme parks and resorts; and Consumer Products, which consist of licensing of its trade names, characters, visual, literary and other intellectual properties.
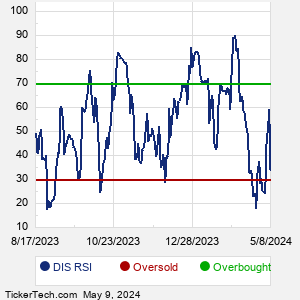
When researching a stock like Walt Disney, many investors are the most familiar with Fundamental Analysis — looking at a company's balance sheet, earnings, revenues, and what's happening in that company's underlying business. Investors who use Fundamental Analysis to identify good stocks to buy or sell can also benefit from DIS Technical Analysis to help find a good entry or exit point. Technical Analysis is blind to the fundamentals and looks only at the trading data for DIS stock — the real life supply and demand for the stock over time — and examines that data in different ways. One of these ways is called the Relative Strength Index, or RSI. This popular indicator, originally developed in the 1970's by J. Welles Wilder, looks at a 14-day moving average of a stock's gains on its up days, versus its losses on its down days. The resulting DIS RSI is a value that measures momentum, oscillating between "oversold" and "overbought" on a scale of zero to 100. A reading below 30 is viewed to be oversold, which a bullish investor could look to as a sign that the selling is in the process of exhausting itself, and look for entry point opportunities. A reading above 70 is viewed to be overbought, which could indicate that a rally in progress is starting to get crowded with buyers. If the rally has been a long one, that could be a sign that a pullback is overdue. |