Assurant is a holding company. Through its subsidiaries, Co. supports, protects and connects consumer purchases. Co.'s segments are: Global Lifestyle, which provides mobile device solutions, extended service products and related services for consumer electronics and appliances, and credit and other insurance products, and vehicle protection, leased and financed solutions and other related services; and Global Housing, which provides lender-placed homeowners insurance, lender-placed manufactured housing insurance and lender-placed flood insurance, renters insurance and related products, and voluntary manufactured housing insurance, voluntary homeowners insurance and other specialty products.
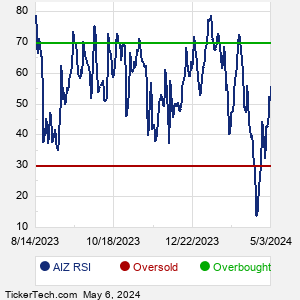
When researching a stock like Assurant, many investors are the most familiar with Fundamental Analysis — looking at a company's balance sheet, earnings, revenues, and what's happening in that company's underlying business. Investors who use Fundamental Analysis to identify good stocks to buy or sell can also benefit from AIZ Technical Analysis to help find a good entry or exit point. Technical Analysis is blind to the fundamentals and looks only at the trading data for AIZ stock — the real life supply and demand for the stock over time — and examines that data in different ways. One of these ways is called the Relative Strength Index, or RSI. This popular indicator, originally developed in the 1970's by J. Welles Wilder, looks at a 14-day moving average of a stock's gains on its up days, versus its losses on its down days. The resulting AIZ RSI is a value that measures momentum, oscillating between "oversold" and "overbought" on a scale of zero to 100. A reading below 30 is viewed to be oversold, which a bullish investor could look to as a sign that the selling is in the process of exhausting itself, and look for entry point opportunities. A reading above 70 is viewed to be overbought, which could indicate that a rally in progress is starting to get crowded with buyers. If the rally has been a long one, that could be a sign that a pullback is overdue. |