Gallagher (Arthur J.) is a holding company. Through its subsidiaries, Co. provides insurance brokerage, consulting, and third-party property/casualty claims settlement and administration services to businesses and organizations. Co.'s segments are: brokerage, which is mainly comprised of its retail and wholesale insurance brokerage operations; risk management, which provides contract claim settlement and administration services for enterprises and public entities that choose to self-insure their property/casualty coverages and for underwriting enterprises that choose to outsource their property/casualty claims departments; and corporate, which manages its clean energy and other investments.
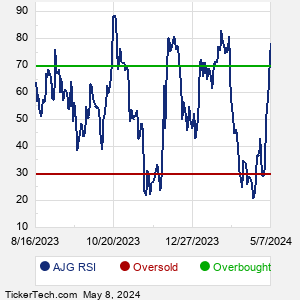
When researching a stock like Arthur J. Gallagher, many investors are the most familiar with Fundamental Analysis — looking at a company's balance sheet, earnings, revenues, and what's happening in that company's underlying business. Investors who use Fundamental Analysis to identify good stocks to buy or sell can also benefit from AJG Technical Analysis to help find a good entry or exit point. Technical Analysis is blind to the fundamentals and looks only at the trading data for AJG stock — the real life supply and demand for the stock over time — and examines that data in different ways. One of these ways is called the Relative Strength Index, or RSI. This popular indicator, originally developed in the 1970's by J. Welles Wilder, looks at a 14-day moving average of a stock's gains on its up days, versus its losses on its down days. The resulting AJG RSI is a value that measures momentum, oscillating between "oversold" and "overbought" on a scale of zero to 100. A reading below 30 is viewed to be oversold, which a bullish investor could look to as a sign that the selling is in the process of exhausting itself, and look for entry point opportunities. A reading above 70 is viewed to be overbought, which could indicate that a rally in progress is starting to get crowded with buyers. If the rally has been a long one, that could be a sign that a pullback is overdue. |