American Express is a payments company. Co. provides credit and charge cards to consumers, small businesses, mid-sized companies and corporations. Co.'s segments are: Global Consumer Services Group, which issues consumer cards and provides travel and lifestyle services and non-card financing products; Global Commercial Services, which issues corporate and small business cards and provides payment, expense management and financing solutions; and Global Merchant and Network Services, which operates a global payments network that processes and settles card transactions, acquires merchants and provides multi-channel marketing programs and capabilities, services and data analytics.
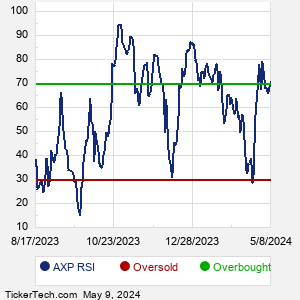
When researching a stock like American Express, many investors are the most familiar with Fundamental Analysis — looking at a company's balance sheet, earnings, revenues, and what's happening in that company's underlying business. Investors who use Fundamental Analysis to identify good stocks to buy or sell can also benefit from AXP Technical Analysis to help find a good entry or exit point. Technical Analysis is blind to the fundamentals and looks only at the trading data for AXP stock — the real life supply and demand for the stock over time — and examines that data in different ways. One of these ways is called the Relative Strength Index, or RSI. This popular indicator, originally developed in the 1970's by J. Welles Wilder, looks at a 14-day moving average of a stock's gains on its up days, versus its losses on its down days. The resulting AXP RSI is a value that measures momentum, oscillating between "oversold" and "overbought" on a scale of zero to 100. A reading below 30 is viewed to be oversold, which a bullish investor could look to as a sign that the selling is in the process of exhausting itself, and look for entry point opportunities. A reading above 70 is viewed to be overbought, which could indicate that a rally in progress is starting to get crowded with buyers. If the rally has been a long one, that could be a sign that a pullback is overdue. |