AbbVie is a research-based biopharmaceutical company. Co. operates as a single business segment dedicated to the research and development, manufacturing, commercialization and sale of medicines and therapies. Co.'s products include: immunology products such as Humira, Skyrizi, and Rinvoq; oncology products such as Imbruvica and Venclexta/Venclyxto; aesthetics products such as Botox Cosmetic and The Juvederm Collection of Fillers; neuroscience products such as Botox Therapeutic, Vraylar, and Ubrelvy; eyecare products such as Lumigan/Ganfort, Alphagan/Combigan, and Restasis; women's health products such as Lo Loestrin and Orilissa/Oriahnn; and other key products such as Creon and Synthroid.
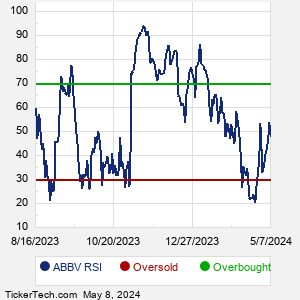
When researching a stock like AbbVie, many investors are the most familiar with Fundamental Analysis — looking at a company's balance sheet, earnings, revenues, and what's happening in that company's underlying business. Investors who use Fundamental Analysis to identify good stocks to buy or sell can also benefit from ABBV Technical Analysis to help find a good entry or exit point. Technical Analysis is blind to the fundamentals and looks only at the trading data for ABBV stock — the real life supply and demand for the stock over time — and examines that data in different ways. One of these ways is called the Relative Strength Index, or RSI. This popular indicator, originally developed in the 1970's by J. Welles Wilder, looks at a 14-day moving average of a stock's gains on its up days, versus its losses on its down days. The resulting ABBV RSI is a value that measures momentum, oscillating between "oversold" and "overbought" on a scale of zero to 100. A reading below 30 is viewed to be oversold, which a bullish investor could look to as a sign that the selling is in the process of exhausting itself, and look for entry point opportunities. A reading above 70 is viewed to be overbought, which could indicate that a rally in progress is starting to get crowded with buyers. If the rally has been a long one, that could be a sign that a pullback is overdue. |