Biogen is a biopharmaceutical company focused on discovering, developing and delivering therapies for neurological and neurodegenerative diseases as well as related therapeutic adjacencies. Co. has a portfolio of medicines to treat multiple sclerosis (MS), spinal muscular atrophy (SMA) and Alzheimer's disease. Co. also commercialize biosimilars of biologics and focuses on improving its pipeline in neuroscience and immunology. Co.'s marketed products include TECFIDERA, VUMERITY, AVONEX, PLEGRIDY, TYSABRI and FAMPYRA for the treatment of MS; SPINRAZA for the treatment of SMA; ADUHELM for the treatment of Alzheimer's disease; and FUMADERM for the treatment of severe plaque psoriasis.
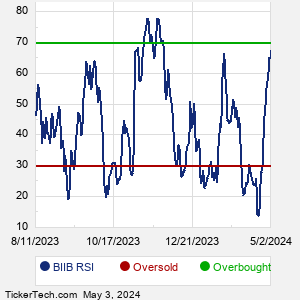
When researching a stock like Biogen, many investors are the most familiar with Fundamental Analysis — looking at a company's balance sheet, earnings, revenues, and what's happening in that company's underlying business. Investors who use Fundamental Analysis to identify good stocks to buy or sell can also benefit from BIIB Technical Analysis to help find a good entry or exit point. Technical Analysis is blind to the fundamentals and looks only at the trading data for BIIB stock — the real life supply and demand for the stock over time — and examines that data in different ways. One of these ways is called the Relative Strength Index, or RSI. This popular indicator, originally developed in the 1970's by J. Welles Wilder, looks at a 14-day moving average of a stock's gains on its up days, versus its losses on its down days. The resulting BIIB RSI is a value that measures momentum, oscillating between "oversold" and "overbought" on a scale of zero to 100. A reading below 30 is viewed to be oversold, which a bullish investor could look to as a sign that the selling is in the process of exhausting itself, and look for entry point opportunities. A reading above 70 is viewed to be overbought, which could indicate that a rally in progress is starting to get crowded with buyers. If the rally has been a long one, that could be a sign that a pullback is overdue. |