Baxter International, through its subsidiaries, provides a portfolio of healthcare products, including acute and chronic dialysis therapies; sterile intravenous solutions; infusion systems and devices; parenteral nutrition therapies; inhaled anesthetics; generic injectable pharmaceuticals; surgical hemostat and sealant products, surgical equipment; smart bed systems; patient monitoring and diagnostic technologies; and respiratory health devices. Co. manages its global operations based on four segments, consisting of the following geographic segments: North and South America, Europe, Middle East and Africa, and Asia-Pacific, and a global segment for its Hill-Rom Holdings, Inc. business.
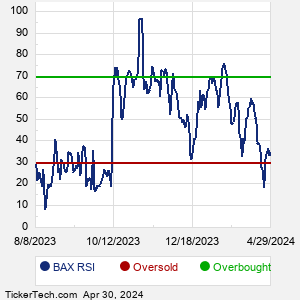
When researching a stock like Baxter International, many investors are the most familiar with Fundamental Analysis — looking at a company's balance sheet, earnings, revenues, and what's happening in that company's underlying business. Investors who use Fundamental Analysis to identify good stocks to buy or sell can also benefit from BAX Technical Analysis to help find a good entry or exit point. Technical Analysis is blind to the fundamentals and looks only at the trading data for BAX stock — the real life supply and demand for the stock over time — and examines that data in different ways. One of these ways is called the Relative Strength Index, or RSI. This popular indicator, originally developed in the 1970's by J. Welles Wilder, looks at a 14-day moving average of a stock's gains on its up days, versus its losses on its down days. The resulting BAX RSI is a value that measures momentum, oscillating between "oversold" and "overbought" on a scale of zero to 100. A reading below 30 is viewed to be oversold, which a bullish investor could look to as a sign that the selling is in the process of exhausting itself, and look for entry point opportunities. A reading above 70 is viewed to be overbought, which could indicate that a rally in progress is starting to get crowded with buyers. If the rally has been a long one, that could be a sign that a pullback is overdue. |