LyondellBasell Industries is a chemical company. Co.'s chemicals businesses consist of processing plants that convert liquid and gaseous hydrocarbon feedstocks into plastic resins and other chemicals, and used by its customers to manufacture a range of products including food packaging, home furnishings, automotive components, paints and coatings. Co.'s refining business consists of its Houston refinery, which processes crude oil into products such as gasoline, diesel and jet fuel. Co.'s reportable segments include: Olefins and Polyolefins - Americas; Olefins and Polyolefins - Europe, Asia, International; Intermediates and Derivatives; Advanced Polymer Solutions; Refining; and Technology.
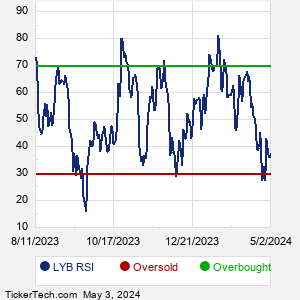
When researching a stock like LyondellBasell Industries NV, many investors are the most familiar with Fundamental Analysis — looking at a company's balance sheet, earnings, revenues, and what's happening in that company's underlying business. Investors who use Fundamental Analysis to identify good stocks to buy or sell can also benefit from LYB Technical Analysis to help find a good entry or exit point. Technical Analysis is blind to the fundamentals and looks only at the trading data for LYB stock — the real life supply and demand for the stock over time — and examines that data in different ways. One of these ways is called the Relative Strength Index, or RSI. This popular indicator, originally developed in the 1970's by J. Welles Wilder, looks at a 14-day moving average of a stock's gains on its up days, versus its losses on its down days. The resulting LYB RSI is a value that measures momentum, oscillating between "oversold" and "overbought" on a scale of zero to 100. A reading below 30 is viewed to be oversold, which a bullish investor could look to as a sign that the selling is in the process of exhausting itself, and look for entry point opportunities. A reading above 70 is viewed to be overbought, which could indicate that a rally in progress is starting to get crowded with buyers. If the rally has been a long one, that could be a sign that a pullback is overdue. |