Steel Dynamics is a steel producer and metal recycler in the U.S. Co. manufactures and sells steel products, processes and sells recycled ferrous and nonferrous metals, and fabricates and sells steel joists and deck products. Co.'s segments include: Steel Operations, which produce steel from ferrous scrap and scrap substitutes, utilize continuous casting, automated rolling mills and various steel coating and process lines; Metals Recycling Operations, which include both ferrous and nonferrous scrap metal processing, transportation, marketing, brokerage and scrap management services; and Steel Fabrication Operations, which serve the non-residential construction industry throughout the U.S.
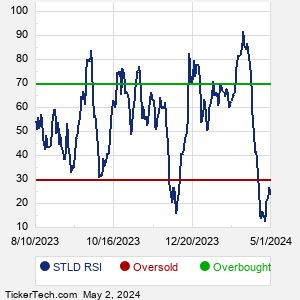
When researching a stock like Steel Dynamics, many investors are the most familiar with Fundamental Analysis — looking at a company's balance sheet, earnings, revenues, and what's happening in that company's underlying business. Investors who use Fundamental Analysis to identify good stocks to buy or sell can also benefit from STLD Technical Analysis to help find a good entry or exit point. Technical Analysis is blind to the fundamentals and looks only at the trading data for STLD stock — the real life supply and demand for the stock over time — and examines that data in different ways. One of these ways is called the Relative Strength Index, or RSI. This popular indicator, originally developed in the 1970's by J. Welles Wilder, looks at a 14-day moving average of a stock's gains on its up days, versus its losses on its down days. The resulting STLD RSI is a value that measures momentum, oscillating between "oversold" and "overbought" on a scale of zero to 100. A reading below 30 is viewed to be oversold, which a bullish investor could look to as a sign that the selling is in the process of exhausting itself, and look for entry point opportunities. A reading above 70 is viewed to be overbought, which could indicate that a rally in progress is starting to get crowded with buyers. If the rally has been a long one, that could be a sign that a pullback is overdue. |