Dollar Tree is an operator of discount variety stores. Co. operates in two reporting business segments: Dollar Tree and Family Dollar. The Dollar Tree segment is an operator of discount variety stores providing merchandise at the fixed price point of $1.25. The merchandise mix in Co.'s Dollar Tree stores consists of: consumable merchandise, variety merchandise, and seasonal goods. The Family Dollar segment operates a chain of general merchandise retail discount stores providing consumers with a selection of merchandise in convenient neighborhood stores. The merchandise mix in Co.'s Family Dollar stores include: consumable merchandise, home products, and apparel and accessories merchandise.
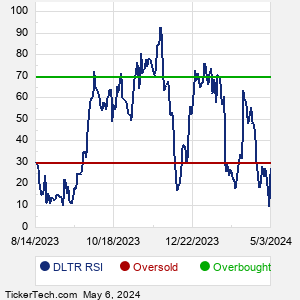
When researching a stock like Dollar Tree, many investors are the most familiar with Fundamental Analysis — looking at a company's balance sheet, earnings, revenues, and what's happening in that company's underlying business. Investors who use Fundamental Analysis to identify good stocks to buy or sell can also benefit from DLTR Technical Analysis to help find a good entry or exit point. Technical Analysis is blind to the fundamentals and looks only at the trading data for DLTR stock — the real life supply and demand for the stock over time — and examines that data in different ways. One of these ways is called the Relative Strength Index, or RSI. This popular indicator, originally developed in the 1970's by J. Welles Wilder, looks at a 14-day moving average of a stock's gains on its up days, versus its losses on its down days. The resulting DLTR RSI is a value that measures momentum, oscillating between "oversold" and "overbought" on a scale of zero to 100. A reading below 30 is viewed to be oversold, which a bullish investor could look to as a sign that the selling is in the process of exhausting itself, and look for entry point opportunities. A reading above 70 is viewed to be overbought, which could indicate that a rally in progress is starting to get crowded with buyers. If the rally has been a long one, that could be a sign that a pullback is overdue. |