VF is an apparel, footwear and accessories company. Co. designs, procures, markets and distributes a variety of branded products, including outerwear, footwear, apparel, backpacks, luggage and accessories. Co.'s segments are: Outdoor, which is a group of authentic outdoor-based lifestyle brands with product offerings that include performance-based and outdoor apparel, footwear and equipment; Active, which is a group of activity-based lifestyle brands with product offerings that include active apparel, footwear, backpacks, luggage and accessories; and Work, which consists of work and work-inspired lifestyle brands with product offerings that include apparel, footwear and accessories.
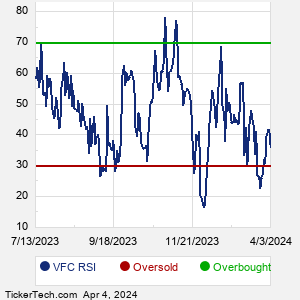
When researching a stock like VF, many investors are the most familiar with Fundamental Analysis — looking at a company's balance sheet, earnings, revenues, and what's happening in that company's underlying business. Investors who use Fundamental Analysis to identify good stocks to buy or sell can also benefit from VFC Technical Analysis to help find a good entry or exit point. Technical Analysis is blind to the fundamentals and looks only at the trading data for VFC stock — the real life supply and demand for the stock over time — and examines that data in different ways. One of these ways is called the Relative Strength Index, or RSI. This popular indicator, originally developed in the 1970's by J. Welles Wilder, looks at a 14-day moving average of a stock's gains on its up days, versus its losses on its down days. The resulting VFC RSI is a value that measures momentum, oscillating between "oversold" and "overbought" on a scale of zero to 100. A reading below 30 is viewed to be oversold, which a bullish investor could look to as a sign that the selling is in the process of exhausting itself, and look for entry point opportunities. A reading above 70 is viewed to be overbought, which could indicate that a rally in progress is starting to get crowded with buyers. If the rally has been a long one, that could be a sign that a pullback is overdue. |