Sempra is a holding company. Through its subsidiaries, Co. has several segments, including: San Diego Gas & Electric Company, which is a regulated public utility that provides electric services in Southern California; Southern California Gas Company, which is a regulated public utility that owns and operates a natural gas distribution, transmission and storage system that supplies natural gas in Southern California and portions of central California; and Sempra Texas Utilities, which includes Oncor Electric Delivery Holdings Company LLC, a regulated electricity transmission and distribution utility that operates in the north-central, eastern, western and panhandle regions of Texas.
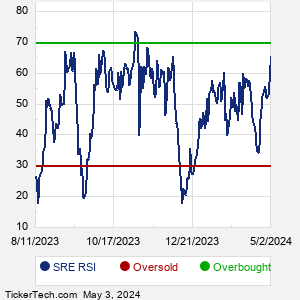
When researching a stock like Sempra Energy, many investors are the most familiar with Fundamental Analysis — looking at a company's balance sheet, earnings, revenues, and what's happening in that company's underlying business. Investors who use Fundamental Analysis to identify good stocks to buy or sell can also benefit from SRE Technical Analysis to help find a good entry or exit point. Technical Analysis is blind to the fundamentals and looks only at the trading data for SRE stock — the real life supply and demand for the stock over time — and examines that data in different ways. One of these ways is called the Relative Strength Index, or RSI. This popular indicator, originally developed in the 1970's by J. Welles Wilder, looks at a 14-day moving average of a stock's gains on its up days, versus its losses on its down days. The resulting SRE RSI is a value that measures momentum, oscillating between "oversold" and "overbought" on a scale of zero to 100. A reading below 30 is viewed to be oversold, which a bullish investor could look to as a sign that the selling is in the process of exhausting itself, and look for entry point opportunities. A reading above 70 is viewed to be overbought, which could indicate that a rally in progress is starting to get crowded with buyers. If the rally has been a long one, that could be a sign that a pullback is overdue. |