Paychex is a provider of human capital management solutions. Co.'s solutions include: payroll processing services, which include the calculation, preparation, and delivery of employee payroll checks and production of internal accounting records and management reports; payroll tax administration services, which provide for preparation and filing of quarterly and year-end tax returns, as well as the electronic transfer of funds to the applicable federal, state, and local tax or regulatory agencies; and regulatory compliance services, which provide new-hire reporting services that enable clients to comply with federal and state requirements to report information on newly hired employees.
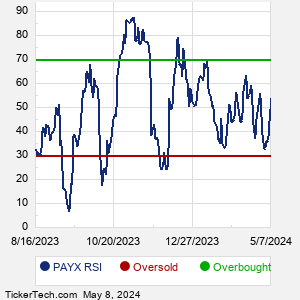
When researching a stock like Paychex, many investors are the most familiar with Fundamental Analysis — looking at a company's balance sheet, earnings, revenues, and what's happening in that company's underlying business. Investors who use Fundamental Analysis to identify good stocks to buy or sell can also benefit from PAYX Technical Analysis to help find a good entry or exit point. Technical Analysis is blind to the fundamentals and looks only at the trading data for PAYX stock — the real life supply and demand for the stock over time — and examines that data in different ways. One of these ways is called the Relative Strength Index, or RSI. This popular indicator, originally developed in the 1970's by J. Welles Wilder, looks at a 14-day moving average of a stock's gains on its up days, versus its losses on its down days. The resulting PAYX RSI is a value that measures momentum, oscillating between "oversold" and "overbought" on a scale of zero to 100. A reading below 30 is viewed to be oversold, which a bullish investor could look to as a sign that the selling is in the process of exhausting itself, and look for entry point opportunities. A reading above 70 is viewed to be overbought, which could indicate that a rally in progress is starting to get crowded with buyers. If the rally has been a long one, that could be a sign that a pullback is overdue. |