Jacobs Solutions is a holding company. Through its subsidiaries, Co. provides technical, other and construction services. Co.'s segments are: Critical Mission Solutions, which includes cyber, data analytics, systems and software application integration services and consulting, enterprise level IT operations and maintenance and mission IT services; People and Places Solutions, which provides solutions related to climate change, energy transition, connected mobility, integrated water management, smart cities and vaccine manufacturing; and its investment in PA Consulting Group Limited, which provides various ideas from concept, through design, development, and to commercial success.
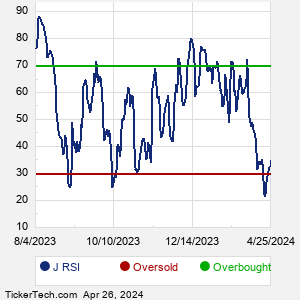
When researching a stock like Jacobs Engineering Group, many investors are the most familiar with Fundamental Analysis — looking at a company's balance sheet, earnings, revenues, and what's happening in that company's underlying business. Investors who use Fundamental Analysis to identify good stocks to buy or sell can also benefit from J Technical Analysis to help find a good entry or exit point. Technical Analysis is blind to the fundamentals and looks only at the trading data for J stock — the real life supply and demand for the stock over time — and examines that data in different ways. One of these ways is called the Relative Strength Index, or RSI. This popular indicator, originally developed in the 1970's by J. Welles Wilder, looks at a 14-day moving average of a stock's gains on its up days, versus its losses on its down days. The resulting J RSI is a value that measures momentum, oscillating between "oversold" and "overbought" on a scale of zero to 100. A reading below 30 is viewed to be oversold, which a bullish investor could look to as a sign that the selling is in the process of exhausting itself, and look for entry point opportunities. A reading above 70 is viewed to be overbought, which could indicate that a rally in progress is starting to get crowded with buyers. If the rally has been a long one, that could be a sign that a pullback is overdue. |