Chevron is engaged in energy and chemicals operations. Upstream operations consist primarily of exploring for, developing, producing and transporting crude oil and natural gas; processing, liquefaction, transportation and regasification associated with liquefied natural gas; transporting crude oil by primary international oil export pipelines; transporting, storage and marketing of natural gas; and a gas-to-liquids plant. Downstream operations consist primarily of refining crude oil into petroleum products; marketing of crude oil, refined products, and lubricants; manufacturing and marketing of renewable fuels; transporting crude oil and refined products; and others.
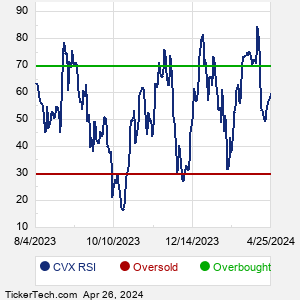
When researching a stock like Chevron, many investors are the most familiar with Fundamental Analysis — looking at a company's balance sheet, earnings, revenues, and what's happening in that company's underlying business. Investors who use Fundamental Analysis to identify good stocks to buy or sell can also benefit from CVX Technical Analysis to help find a good entry or exit point. Technical Analysis is blind to the fundamentals and looks only at the trading data for CVX stock — the real life supply and demand for the stock over time — and examines that data in different ways. One of these ways is called the Relative Strength Index, or RSI. This popular indicator, originally developed in the 1970's by J. Welles Wilder, looks at a 14-day moving average of a stock's gains on its up days, versus its losses on its down days. The resulting CVX RSI is a value that measures momentum, oscillating between "oversold" and "overbought" on a scale of zero to 100. A reading below 30 is viewed to be oversold, which a bullish investor could look to as a sign that the selling is in the process of exhausting itself, and look for entry point opportunities. A reading above 70 is viewed to be overbought, which could indicate that a rally in progress is starting to get crowded with buyers. If the rally has been a long one, that could be a sign that a pullback is overdue. |