Universal Health Services is a holding company. Co.'s principal business is owning and operating, through its subsidiaries, acute care hospitals and outpatient facilities and behavioral health care facilities. Services provided by Co.'s hospitals include general and specialty surgery, internal medicine, obstetrics, emergency room care, radiology, oncology, diagnostic care, coronary care, pediatric services, pharmacy services and/or behavioral health services. Co. provides capital resources as well as a variety of management services to its facilities, including central purchasing, information services, finance and control systems, facilities planning and physician recruitment services.
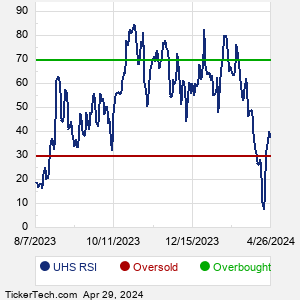
When researching a stock like Universal Health Services, many investors are the most familiar with Fundamental Analysis — looking at a company's balance sheet, earnings, revenues, and what's happening in that company's underlying business. Investors who use Fundamental Analysis to identify good stocks to buy or sell can also benefit from UHS Technical Analysis to help find a good entry or exit point. Technical Analysis is blind to the fundamentals and looks only at the trading data for UHS stock — the real life supply and demand for the stock over time — and examines that data in different ways. One of these ways is called the Relative Strength Index, or RSI. This popular indicator, originally developed in the 1970's by J. Welles Wilder, looks at a 14-day moving average of a stock's gains on its up days, versus its losses on its down days. The resulting UHS RSI is a value that measures momentum, oscillating between "oversold" and "overbought" on a scale of zero to 100. A reading below 30 is viewed to be oversold, which a bullish investor could look to as a sign that the selling is in the process of exhausting itself, and look for entry point opportunities. A reading above 70 is viewed to be overbought, which could indicate that a rally in progress is starting to get crowded with buyers. If the rally has been a long one, that could be a sign that a pullback is overdue. |