Under Armour is engaged in developing, marketing and distributing branded performance apparel, footwear and accessories for men, women and youth. Co.'s product offerings consist of apparel, footwear and accessories for men, women and youth. Co. markets its products at various price levels. Co.'s apparel comes in three primary fit types: compression (tight fit), fitted (athletic fit) and loose (relaxed fit). Footwear includes products for running, training, basketball, cleated sports, recovery and outdoor applications. Accessories primarily includes the sale of athletic performance gloves, bags, headwear, socks and sports masks.
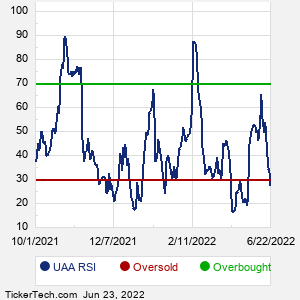
When researching a stock like Under Armour, many investors are the most familiar with Fundamental Analysis — looking at a company's balance sheet, earnings, revenues, and what's happening in that company's underlying business. Investors who use Fundamental Analysis to identify good stocks to buy or sell can also benefit from UAA Technical Analysis to help find a good entry or exit point. Technical Analysis is blind to the fundamentals and looks only at the trading data for UAA stock — the real life supply and demand for the stock over time — and examines that data in different ways. One of these ways is called the Relative Strength Index, or RSI. This popular indicator, originally developed in the 1970's by J. Welles Wilder, looks at a 14-day moving average of a stock's gains on its up days, versus its losses on its down days. The resulting UAA RSI is a value that measures momentum, oscillating between "oversold" and "overbought" on a scale of zero to 100. A reading below 30 is viewed to be oversold, which a bullish investor could look to as a sign that the selling is in the process of exhausting itself, and look for entry point opportunities. A reading above 70 is viewed to be overbought, which could indicate that a rally in progress is starting to get crowded with buyers. If the rally has been a long one, that could be a sign that a pullback is overdue. |