Twitter helps people discover what's happening through text, images, on demand and live video, and audio from people, content partners, media organizations, advertisers and others. Co.'s primary product, Twitter, is a global platform for public self-expression and conversation in real time. Co.'s products and services for advertisers include Promoted Products such as Promoted Ads and Twitter Amplify, Follower Ads, and Twitter Takeover. Co.'s products for developers and data partners include Twitter Developer Platform, which supports developers around the world to build tools for people and businesses using its public application programming interface.
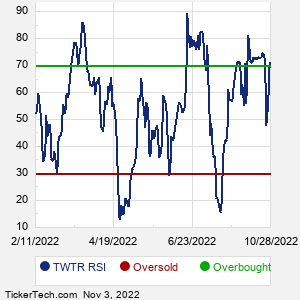
When researching a stock like Twitter, many investors are the most familiar with Fundamental Analysis — looking at a company's balance sheet, earnings, revenues, and what's happening in that company's underlying business. Investors who use Fundamental Analysis to identify good stocks to buy or sell can also benefit from TWTR Technical Analysis to help find a good entry or exit point. Technical Analysis is blind to the fundamentals and looks only at the trading data for TWTR stock — the real life supply and demand for the stock over time — and examines that data in different ways. One of these ways is called the Relative Strength Index, or RSI. This popular indicator, originally developed in the 1970's by J. Welles Wilder, looks at a 14-day moving average of a stock's gains on its up days, versus its losses on its down days. The resulting TWTR RSI is a value that measures momentum, oscillating between "oversold" and "overbought" on a scale of zero to 100. A reading below 30 is viewed to be oversold, which a bullish investor could look to as a sign that the selling is in the process of exhausting itself, and look for entry point opportunities. A reading above 70 is viewed to be overbought, which could indicate that a rally in progress is starting to get crowded with buyers. If the rally has been a long one, that could be a sign that a pullback is overdue. |