Trane Technologies designs, manufactures, sells and services a range of climate control solutions for heating, ventilation and air conditioning (HVAC) and transport refrigeration. Co.'s segments are: Americas, which includes commercial heating and cooling systems, building controls, and energy services and solutions, residential heating and cooling, and transport refrigeration systems and solutions in North America and Latin America regions; Europe, Middle East and Africa (EMEA) and Asia Pacific, which include heating and cooling systems, services and solutions for commercial buildings and industrial processing, and transport refrigeration systems and solutions in EMEA and Asia Pacific.
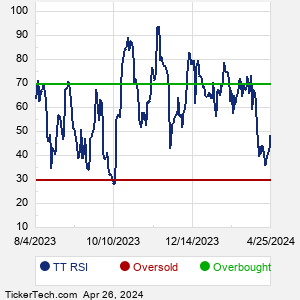
When researching a stock like Trane Technologies, many investors are the most familiar with Fundamental Analysis — looking at a company's balance sheet, earnings, revenues, and what's happening in that company's underlying business. Investors who use Fundamental Analysis to identify good stocks to buy or sell can also benefit from TT Technical Analysis to help find a good entry or exit point. Technical Analysis is blind to the fundamentals and looks only at the trading data for TT stock — the real life supply and demand for the stock over time — and examines that data in different ways. One of these ways is called the Relative Strength Index, or RSI. This popular indicator, originally developed in the 1970's by J. Welles Wilder, looks at a 14-day moving average of a stock's gains on its up days, versus its losses on its down days. The resulting TT RSI is a value that measures momentum, oscillating between "oversold" and "overbought" on a scale of zero to 100. A reading below 30 is viewed to be oversold, which a bullish investor could look to as a sign that the selling is in the process of exhausting itself, and look for entry point opportunities. A reading above 70 is viewed to be overbought, which could indicate that a rally in progress is starting to get crowded with buyers. If the rally has been a long one, that could be a sign that a pullback is overdue. |