Tiffany & Co. is a holding company that operates through its principal subsidiary, Tiffany and Company and Co.'s other subsidiary companies. Through its subsidiaries, Co. designs and manufactures products and operates TIFFANY & CO. retail stores worldwide, and also sells its products through Internet, catalog, business-to-business and wholesale distribution. Co.'s principal product category is jewelry. Co. provides a selection of TIFFANY & CO. brand jewelry at a range of prices. Co. also sells watches, home and accessories products and fragrances. Co. has four reportable segments: Americas, Asia-Pacific, Japan and Europe.
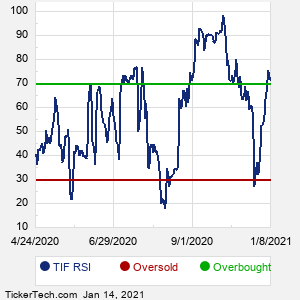
When researching a stock like Tiffany, many investors are the most familiar with Fundamental Analysis — looking at a company's balance sheet, earnings, revenues, and what's happening in that company's underlying business. Investors who use Fundamental Analysis to identify good stocks to buy or sell can also benefit from TIF Technical Analysis to help find a good entry or exit point. Technical Analysis is blind to the fundamentals and looks only at the trading data for TIF stock — the real life supply and demand for the stock over time — and examines that data in different ways. One of these ways is called the Relative Strength Index, or RSI. This popular indicator, originally developed in the 1970's by J. Welles Wilder, looks at a 14-day moving average of a stock's gains on its up days, versus its losses on its down days. The resulting TIF RSI is a value that measures momentum, oscillating between "oversold" and "overbought" on a scale of zero to 100. A reading below 30 is viewed to be oversold, which a bullish investor could look to as a sign that the selling is in the process of exhausting itself, and look for entry point opportunities. A reading above 70 is viewed to be overbought, which could indicate that a rally in progress is starting to get crowded with buyers. If the rally has been a long one, that could be a sign that a pullback is overdue. |