Target provides its customers everyday essentials and merchandise. Co. sells an assortment of general merchandise and food. The majority of Co.'s general merchandise stores provide an edited food assortment, including perishables, dry grocery, dairy, and frozen items. Co.'s small format stores provide curated general merchandise and food assortments. Co.'s digital channels include a merchandise assortment, including various items found in its stores, along with a complementary assortment sold by Co. and third parties. Co.'s owned brands include: A New Day™, All in Motion™, Archer Farms™, Art Class™, Auden™, Ava & Viv™, Boots & Barkley®, Brightroom™, and Bullseye's Playground™, among others.
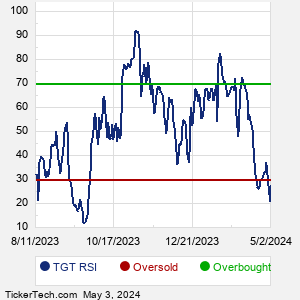
When researching a stock like Target, many investors are the most familiar with Fundamental Analysis — looking at a company's balance sheet, earnings, revenues, and what's happening in that company's underlying business. Investors who use Fundamental Analysis to identify good stocks to buy or sell can also benefit from TGT Technical Analysis to help find a good entry or exit point. Technical Analysis is blind to the fundamentals and looks only at the trading data for TGT stock — the real life supply and demand for the stock over time — and examines that data in different ways. One of these ways is called the Relative Strength Index, or RSI. This popular indicator, originally developed in the 1970's by J. Welles Wilder, looks at a 14-day moving average of a stock's gains on its up days, versus its losses on its down days. The resulting TGT RSI is a value that measures momentum, oscillating between "oversold" and "overbought" on a scale of zero to 100. A reading below 30 is viewed to be oversold, which a bullish investor could look to as a sign that the selling is in the process of exhausting itself, and look for entry point opportunities. A reading above 70 is viewed to be overbought, which could indicate that a rally in progress is starting to get crowded with buyers. If the rally has been a long one, that could be a sign that a pullback is overdue. |