Ross Stores operates two brands of off-price retail apparel and home fashion stores, Ross Dress for Less® (Ross) and dd's DISCOUNTS®. Co. is an apparel and home fashion chain in the U.S., with various locations in several states, the District of Columbia, and Guam. Co. provides name brand and designer apparel, accessories, footwear, and home fashions for the family. Co.'s target customers are from middle income households. Co. also operates various dd's DISCOUNTS stores in several states. dd's DISCOUNTS features name brand apparel, accessories, footwear, and home fashions for the family. The merchant, store field, and distribution operations for Ross and dd's DISCOUNTS are separate.
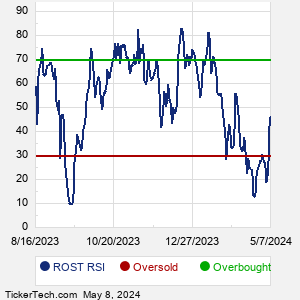
When researching a stock like Ross Stores, many investors are the most familiar with Fundamental Analysis — looking at a company's balance sheet, earnings, revenues, and what's happening in that company's underlying business. Investors who use Fundamental Analysis to identify good stocks to buy or sell can also benefit from ROST Technical Analysis to help find a good entry or exit point. Technical Analysis is blind to the fundamentals and looks only at the trading data for ROST stock — the real life supply and demand for the stock over time — and examines that data in different ways. One of these ways is called the Relative Strength Index, or RSI. This popular indicator, originally developed in the 1970's by J. Welles Wilder, looks at a 14-day moving average of a stock's gains on its up days, versus its losses on its down days. The resulting ROST RSI is a value that measures momentum, oscillating between "oversold" and "overbought" on a scale of zero to 100. A reading below 30 is viewed to be oversold, which a bullish investor could look to as a sign that the selling is in the process of exhausting itself, and look for entry point opportunities. A reading above 70 is viewed to be overbought, which could indicate that a rally in progress is starting to get crowded with buyers. If the rally has been a long one, that could be a sign that a pullback is overdue. |