Royal Caribbean Group is a cruise company. Co. owns and operates three global cruise brands: Royal Caribbean International, Celebrity Cruises and Silversea Cruises (collectively, Global Brands). Co. also owns a joint venture interest in TUI Cruises GmbH, which operates the German brands TUI Cruises and Hapag-Lloyd Cruises (collectively, Partner Brands). Co.'s Global Brands and its Partner Brands have ships in the cruise vacation industry. Co.'s ships provide worldwide itineraries that call on several continents. Co. handles various travel aspects related to guest reservations and transportation, including facilitating guest pre- and post-hotel stay arrangements and air transportation.
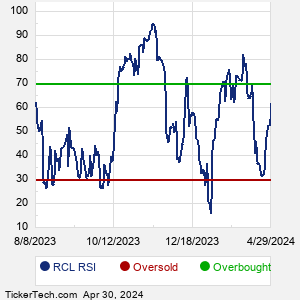
When researching a stock like Royal Caribbean Cruises, many investors are the most familiar with Fundamental Analysis — looking at a company's balance sheet, earnings, revenues, and what's happening in that company's underlying business. Investors who use Fundamental Analysis to identify good stocks to buy or sell can also benefit from RCL Technical Analysis to help find a good entry or exit point. Technical Analysis is blind to the fundamentals and looks only at the trading data for RCL stock — the real life supply and demand for the stock over time — and examines that data in different ways. One of these ways is called the Relative Strength Index, or RSI. This popular indicator, originally developed in the 1970's by J. Welles Wilder, looks at a 14-day moving average of a stock's gains on its up days, versus its losses on its down days. The resulting RCL RSI is a value that measures momentum, oscillating between "oversold" and "overbought" on a scale of zero to 100. A reading below 30 is viewed to be oversold, which a bullish investor could look to as a sign that the selling is in the process of exhausting itself, and look for entry point opportunities. A reading above 70 is viewed to be overbought, which could indicate that a rally in progress is starting to get crowded with buyers. If the rally has been a long one, that could be a sign that a pullback is overdue. |