PACCAR is a multinational company operating in the following principal segments: the Truck, which includes the design manufacture and distribution of light-, medium- and heavy-duty commercial trucks; the Parts, which includes the distribution of aftermarket parts for trucks and related commercial vehicles; and the Financial Services, which includes finance and leasing products and services provided to customers and dealers. Co.'s other businesses include the manufacturing of industrial winches in two U.S. plants and marketing them under the Braden, Carco and Gearmatic nameplates.
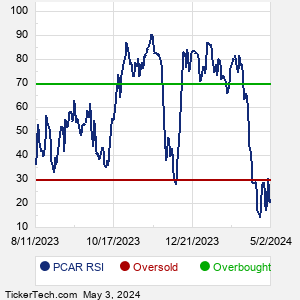
When researching a stock like PACCAR, many investors are the most familiar with Fundamental Analysis — looking at a company's balance sheet, earnings, revenues, and what's happening in that company's underlying business. Investors who use Fundamental Analysis to identify good stocks to buy or sell can also benefit from PCAR Technical Analysis to help find a good entry or exit point. Technical Analysis is blind to the fundamentals and looks only at the trading data for PCAR stock — the real life supply and demand for the stock over time — and examines that data in different ways. One of these ways is called the Relative Strength Index, or RSI. This popular indicator, originally developed in the 1970's by J. Welles Wilder, looks at a 14-day moving average of a stock's gains on its up days, versus its losses on its down days. The resulting PCAR RSI is a value that measures momentum, oscillating between "oversold" and "overbought" on a scale of zero to 100. A reading below 30 is viewed to be oversold, which a bullish investor could look to as a sign that the selling is in the process of exhausting itself, and look for entry point opportunities. A reading above 70 is viewed to be overbought, which could indicate that a rally in progress is starting to get crowded with buyers. If the rally has been a long one, that could be a sign that a pullback is overdue. |