Oracle provides products and services that address enterprise information technology environments. Co.'s products and services include enterprise applications and infrastructure offerings. Co.'s cloud and license business engages in the sale, marketing and delivery of its enterprise applications and infrastructure technologies through cloud and on-premise deployment models including its cloud services and license support offerings; and its cloud license and on-premise license offerings. Co.'s hardware business provides Oracle Engineered Systems, servers, storage, industry-specific hardware, operating systems, virtualization, management and other hardware-related software.
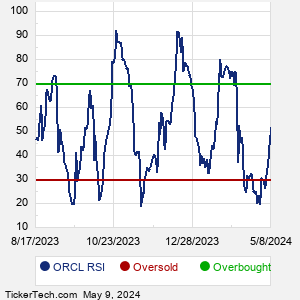
When researching a stock like Oracle, many investors are the most familiar with Fundamental Analysis — looking at a company's balance sheet, earnings, revenues, and what's happening in that company's underlying business. Investors who use Fundamental Analysis to identify good stocks to buy or sell can also benefit from ORCL Technical Analysis to help find a good entry or exit point. Technical Analysis is blind to the fundamentals and looks only at the trading data for ORCL stock — the real life supply and demand for the stock over time — and examines that data in different ways. One of these ways is called the Relative Strength Index, or RSI. This popular indicator, originally developed in the 1970's by J. Welles Wilder, looks at a 14-day moving average of a stock's gains on its up days, versus its losses on its down days. The resulting ORCL RSI is a value that measures momentum, oscillating between "oversold" and "overbought" on a scale of zero to 100. A reading below 30 is viewed to be oversold, which a bullish investor could look to as a sign that the selling is in the process of exhausting itself, and look for entry point opportunities. A reading above 70 is viewed to be overbought, which could indicate that a rally in progress is starting to get crowded with buyers. If the rally has been a long one, that could be a sign that a pullback is overdue. |