Match Group is a provider of digital technologies designed to help people make connections. Co.'s portfolio of brands include: Tinder®, Match®, Meetic®, OkCupid®, Pairs™, and Plenty Of Fish®, which provide services in the online dating category; Hinge®, which is for relationship-minded individuals; Azar®, which is a one-to-one video chat service; Hakuna™ Live, which allows for one-to-many live streaming; and The League®, which is a dating platform focused on career-oriented individuals. Through its brands, Co. provides services to meet the varying preferences of its users. In addition, Co.'s portfolio includes brands such as Chispa™ and BLK®.
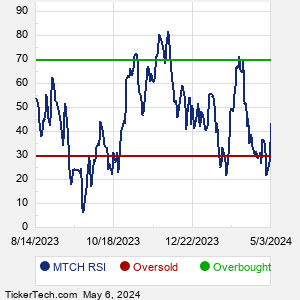
When researching a stock like Match Group, many investors are the most familiar with Fundamental Analysis — looking at a company's balance sheet, earnings, revenues, and what's happening in that company's underlying business. Investors who use Fundamental Analysis to identify good stocks to buy or sell can also benefit from MTCH Technical Analysis to help find a good entry or exit point. Technical Analysis is blind to the fundamentals and looks only at the trading data for MTCH stock — the real life supply and demand for the stock over time — and examines that data in different ways. One of these ways is called the Relative Strength Index, or RSI. This popular indicator, originally developed in the 1970's by J. Welles Wilder, looks at a 14-day moving average of a stock's gains on its up days, versus its losses on its down days. The resulting MTCH RSI is a value that measures momentum, oscillating between "oversold" and "overbought" on a scale of zero to 100. A reading below 30 is viewed to be oversold, which a bullish investor could look to as a sign that the selling is in the process of exhausting itself, and look for entry point opportunities. A reading above 70 is viewed to be overbought, which could indicate that a rally in progress is starting to get crowded with buyers. If the rally has been a long one, that could be a sign that a pullback is overdue. |