MGM Resorts International is a holding company. Through its subsidiaries, Co. is a gaming and entertainment company. Co. has three segments: Las Vegas Strip Resorts, which consists of Aria, Bellagio, The Cosmopolitan, MGM Grand Las Vegas, Mandalay Bay, Luxor, New York-New York, Excalibur, and Park MGM; Regional Operations, which consists of MGM Grand Detroit in Detroit, MI; Beau Rivage in Biloxi, MS; Gold Strike Tunica in Tunica, MS; Borgata in Atlantic City, NJ; MGM National Harbor in Prince George's County, MD; MGM Springfield in Springfield, MA; and Empire City in Yonkers, NY; and MGM Northfield Park in Northfield Park, OH; and MGM China, which consists of MGM Macau and MGM Cotai.
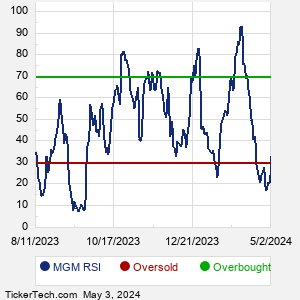
When researching a stock like MGM Resorts International, many investors are the most familiar with Fundamental Analysis — looking at a company's balance sheet, earnings, revenues, and what's happening in that company's underlying business. Investors who use Fundamental Analysis to identify good stocks to buy or sell can also benefit from MGM Technical Analysis to help find a good entry or exit point. Technical Analysis is blind to the fundamentals and looks only at the trading data for MGM stock — the real life supply and demand for the stock over time — and examines that data in different ways. One of these ways is called the Relative Strength Index, or RSI. This popular indicator, originally developed in the 1970's by J. Welles Wilder, looks at a 14-day moving average of a stock's gains on its up days, versus its losses on its down days. The resulting MGM RSI is a value that measures momentum, oscillating between "oversold" and "overbought" on a scale of zero to 100. A reading below 30 is viewed to be oversold, which a bullish investor could look to as a sign that the selling is in the process of exhausting itself, and look for entry point opportunities. A reading above 70 is viewed to be overbought, which could indicate that a rally in progress is starting to get crowded with buyers. If the rally has been a long one, that could be a sign that a pullback is overdue. |