Meta Platforms builds technology that helps people connect, find communities, and improve businesses. Co. has two segments: Family of Apps, which includes Facebook, Instagram, Messenger and WhatsApp; and Reality Labs, which includes Meta Quest virtual reality devices, as well as software and content available through the Meta Quest Store. Co. has launched Horizon Worlds, a social platform where people can interact with friends, meet new people, play games, and attend virtual events, and Horizon Workrooms, a virtual reality space for teams to connect and collaborate at work. As part of its augmented reality initiatives, Co. has introduced Ray-Ban Stories smart glasses and Meta Spark.
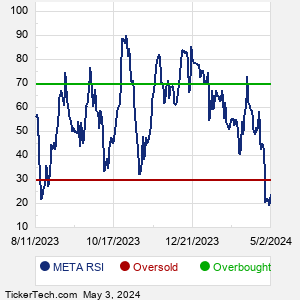
When researching a stock like Meta Platforms, many investors are the most familiar with Fundamental Analysis — looking at a company's balance sheet, earnings, revenues, and what's happening in that company's underlying business. Investors who use Fundamental Analysis to identify good stocks to buy or sell can also benefit from META Technical Analysis to help find a good entry or exit point. Technical Analysis is blind to the fundamentals and looks only at the trading data for META stock — the real life supply and demand for the stock over time — and examines that data in different ways. One of these ways is called the Relative Strength Index, or RSI. This popular indicator, originally developed in the 1970's by J. Welles Wilder, looks at a 14-day moving average of a stock's gains on its up days, versus its losses on its down days. The resulting META RSI is a value that measures momentum, oscillating between "oversold" and "overbought" on a scale of zero to 100. A reading below 30 is viewed to be oversold, which a bullish investor could look to as a sign that the selling is in the process of exhausting itself, and look for entry point opportunities. A reading above 70 is viewed to be overbought, which could indicate that a rally in progress is starting to get crowded with buyers. If the rally has been a long one, that could be a sign that a pullback is overdue. |