Las Vegas Sands develops destination properties (Integrated Resorts) that feature accommodations, gaming, entertainment and retail malls, convention and exhibition facilities, restaurants and other amenities. Co. owns and operates Integrated Resorts in Macao and Singapore. Through its ownership of Sands China Ltd., Co. owns and operates a collection of Integrated Resorts in the Macao Special Administrative Region (Macao) of the People's Republic of China. These properties include The Venetian Macao Resort Hotel; The Londoner Macao; The Parisian Macao; The Plaza Macao and Four Seasons Hotel Macao, Cotai Strip; and the Sands Macao. In Singapore, Co. owns and operates the Marina Bay Sands.
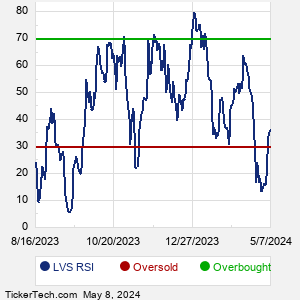
When researching a stock like Las Vegas Sands, many investors are the most familiar with Fundamental Analysis — looking at a company's balance sheet, earnings, revenues, and what's happening in that company's underlying business. Investors who use Fundamental Analysis to identify good stocks to buy or sell can also benefit from LVS Technical Analysis to help find a good entry or exit point. Technical Analysis is blind to the fundamentals and looks only at the trading data for LVS stock — the real life supply and demand for the stock over time — and examines that data in different ways. One of these ways is called the Relative Strength Index, or RSI. This popular indicator, originally developed in the 1970's by J. Welles Wilder, looks at a 14-day moving average of a stock's gains on its up days, versus its losses on its down days. The resulting LVS RSI is a value that measures momentum, oscillating between "oversold" and "overbought" on a scale of zero to 100. A reading below 30 is viewed to be oversold, which a bullish investor could look to as a sign that the selling is in the process of exhausting itself, and look for entry point opportunities. A reading above 70 is viewed to be overbought, which could indicate that a rally in progress is starting to get crowded with buyers. If the rally has been a long one, that could be a sign that a pullback is overdue. |