L3Harris Technologies is a global aerospace and defense technology innovator, delivering end-to-end solutions. Co.'s reportable segments are: Integrated Mission Systems, which is comprised of intelligence, surveillance and reconnaissance, Maritime and Electro Optical; Space and Airborne Systems, which is comprised of Space, Intel and Cyber, Avionics and Electronic Warfare; Communication Systems, which is comprised of Tactical Communications, Broadband Communications, Integrated Vision Solutions, Public Safety and Global Communications; and Aviation Systems, which is comprised of Mission Networks, Defense Aviation, Commercial Aviation Products and Commercial Pilot Training.
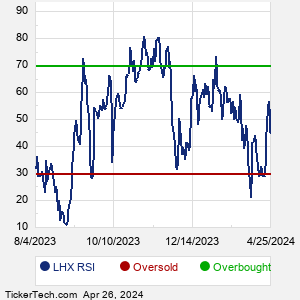
When researching a stock like L3Harris Technologies, many investors are the most familiar with Fundamental Analysis — looking at a company's balance sheet, earnings, revenues, and what's happening in that company's underlying business. Investors who use Fundamental Analysis to identify good stocks to buy or sell can also benefit from LHX Technical Analysis to help find a good entry or exit point. Technical Analysis is blind to the fundamentals and looks only at the trading data for LHX stock — the real life supply and demand for the stock over time — and examines that data in different ways. One of these ways is called the Relative Strength Index, or RSI. This popular indicator, originally developed in the 1970's by J. Welles Wilder, looks at a 14-day moving average of a stock's gains on its up days, versus its losses on its down days. The resulting LHX RSI is a value that measures momentum, oscillating between "oversold" and "overbought" on a scale of zero to 100. A reading below 30 is viewed to be oversold, which a bullish investor could look to as a sign that the selling is in the process of exhausting itself, and look for entry point opportunities. A reading above 70 is viewed to be overbought, which could indicate that a rally in progress is starting to get crowded with buyers. If the rally has been a long one, that could be a sign that a pullback is overdue. |