Illumina is engaged in sequencing- and array-based solutions for genetic and genomic analysis. Co.'s products and services enable the adoption of genomic solutions in research and clinical settings. Co.'s principal products, services, and technologies are: sequencing, which includes Deoxyribonucleic acid (DNA) sequencing, a process of determining the order of nucleotide bases (A, C, G, or T) in a DNA sample; arrays, which are used for a range of DNA and RNA analysis applications; consumables, which Co. has developed various library preparation and sequencing kits; and services, which provides whole-genome sequencing, genotyping, noninvasive prenatal testing, and product support services.
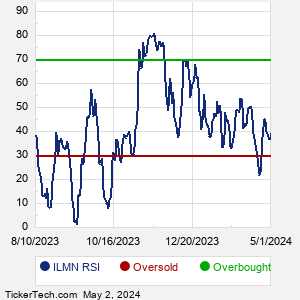
When researching a stock like Illumina, many investors are the most familiar with Fundamental Analysis — looking at a company's balance sheet, earnings, revenues, and what's happening in that company's underlying business. Investors who use Fundamental Analysis to identify good stocks to buy or sell can also benefit from ILMN Technical Analysis to help find a good entry or exit point. Technical Analysis is blind to the fundamentals and looks only at the trading data for ILMN stock — the real life supply and demand for the stock over time — and examines that data in different ways. One of these ways is called the Relative Strength Index, or RSI. This popular indicator, originally developed in the 1970's by J. Welles Wilder, looks at a 14-day moving average of a stock's gains on its up days, versus its losses on its down days. The resulting ILMN RSI is a value that measures momentum, oscillating between "oversold" and "overbought" on a scale of zero to 100. A reading below 30 is viewed to be oversold, which a bullish investor could look to as a sign that the selling is in the process of exhausting itself, and look for entry point opportunities. A reading above 70 is viewed to be overbought, which could indicate that a rally in progress is starting to get crowded with buyers. If the rally has been a long one, that could be a sign that a pullback is overdue. |