Hewlett Packard Enterprise RSI


HPE RSIHPE DMA
Hewlett Packard Enterprise is a technology provider. Co.'s operations has six business segments: Compute, which provides both general purpose servers for multi-workload computing and workload-optimized servers; High Performance Computing and Artificial Intelligence, which provides integrated systems comprised of software and hardware; Storage, which includes primary storage product and service offerings; Intelligent Edge, which comprises of a portfolio of secure edge-to-cloud solutions operating under the Aruba brand; Financial Services, which provides flexible investment solutions; and Corporate Investments and Other, which includes the Advisory and Professional Services business.

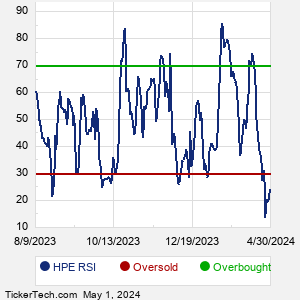
When researching a stock like Hewlett Packard Enterprise, many investors are the most familiar with Fundamental Analysis — looking at a company's balance sheet, earnings, revenues, and what's happening in that company's underlying business. Investors who use Fundamental Analysis to identify good stocks to buy or sell can also benefit from HPE Technical Analysis to help find a good entry or exit point. Technical Analysis is blind to the fundamentals and looks only at the trading data for HPE stock — the real life supply and demand for the stock over time — and examines that data in different ways. One of these ways is called the Relative Strength Index, or RSI. This popular indicator, originally developed in the 1970's by J. Welles Wilder, looks at a 14-day moving average of a stock's gains on its up days, versus its losses on its down days. The resulting HPE RSI is a value that measures momentum, oscillating between "oversold" and "overbought" on a scale of zero to 100. A reading below 30 is viewed to be oversold, which a bullish investor could look to as a sign that the selling is in the process of exhausting itself, and look for entry point opportunities. A reading above 70 is viewed to be overbought, which could indicate that a rally in progress is starting to get crowded with buyers. If the rally has been a long one, that could be a sign that a pullback is overdue.
10 Most Oversold S&P 500 Stocks
10 Most Overbought S&P 500 Stocks

10 ETFs With Stocks Insiders Are Buying
10 ETFs With Most Upside To Targets
The DividendRank Top 25
Warren Buffett Dividend Stocks
10 Cheap Dividend Stocks Under $10
10 Top DividendRank'ed Energy Stocks
The 10 Highest Yielding Preferred Stocks
The 15 Most Active S&P Call & Put Options
Quotes delayed 20 minutes

Email EnvelopeFree HPE Email Alerts:
Get Dividend Alerts
Get SEC Filing Alerts
Video: RSI Indicator


If the video does not load after a few moments, Upgrade to the Latest Flash Player.
Hewlett Packard Enterprise (HPE) is categorized under the Technology sector; to help you further research RSI, below are some other companies in the same sector:

HPQ RSI
IBM RSI
INTC RSI
IRM RSI
JKHY RSI
JNPR RSI
KLAC RSI
MCHP RSI
MPWR RSI
MSFT RSI
More Technology companies »


Hewlett Packard Enterprise RSI | www.StockRSI.com | Copyright © 2019 - 2024, All Rights Reserved

Nothing in StockRSI.com is intended to be investment advice, nor does it represent the opinion of, counsel from, or recommendations by BNK Invest Inc. or any of its affiliates, subsidiaries or partners. None of the information contained herein constitutes a recommendation that any particular security, portfolio, transaction, or investment strategy is suitable for any specific person. All viewers agree that under no circumstances will BNK Invest, Inc,. its subsidiaries, partners, officers, employees, affiliates, or agents be held liable for any loss or damage caused by your reliance on information obtained. By visiting, using or viewing this site, you agree to the following Full Disclaimer & Terms of Use and Privacy Policy. Video widget and market videos powered by Market News Video. Quote and option data delayed at least 15 minutes; stock quote data powered by Ticker Technologies, and Mergent.
X
Wait! Don't leave yet.
Want to receive our latest research absolutely free?


Click the button below for your complimentary copy of Your Early Retirement Portfolio: Dividends Up to 8.7%—Every Month—Forever.

You'll discover the details on 4 stocks and funds that pay you massive dividends as high as 8.7%.