Gilead Sciences is a biopharmaceutical company, focusing on medicines to prevent and treat diseases, including HIV, viral hepatitis and cancer. Co.'s products include: Biktarvy®, which is an oral formulation dosed once a day for the treatment of HIV-1 infection in certain patients; Veklury® (remdesivir), an injection for intravenous use, which is a nucleotide analog RNA polymerase inhibitor indicated for certain patients for the treatment of COVID-19 requiring hospitalization; and Epclusa®, which is an oral formulation of a once-daily single tablet regimen of sofosbuvir and velpatasvir for the treatment of chronic hepatitis C virus (HCV) infection in adults and certain pediatric patients.
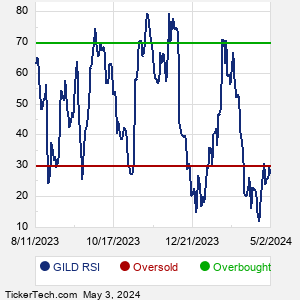
When researching a stock like Gilead Sciences, many investors are the most familiar with Fundamental Analysis — looking at a company's balance sheet, earnings, revenues, and what's happening in that company's underlying business. Investors who use Fundamental Analysis to identify good stocks to buy or sell can also benefit from GILD Technical Analysis to help find a good entry or exit point. Technical Analysis is blind to the fundamentals and looks only at the trading data for GILD stock — the real life supply and demand for the stock over time — and examines that data in different ways. One of these ways is called the Relative Strength Index, or RSI. This popular indicator, originally developed in the 1970's by J. Welles Wilder, looks at a 14-day moving average of a stock's gains on its up days, versus its losses on its down days. The resulting GILD RSI is a value that measures momentum, oscillating between "oversold" and "overbought" on a scale of zero to 100. A reading below 30 is viewed to be oversold, which a bullish investor could look to as a sign that the selling is in the process of exhausting itself, and look for entry point opportunities. A reading above 70 is viewed to be overbought, which could indicate that a rally in progress is starting to get crowded with buyers. If the rally has been a long one, that could be a sign that a pullback is overdue. |