The Gap is a collection of lifestyle brands providing apparel, accessories, and personal care products for women, men, and children under the Old Navy, Gap, Banana Republic, and Athleta brands. Co. is an omni-channel retailer, with sales to customers both in stores and online, through Co.-operated and franchise stores, Co.-owned websites, and third-party arrangements. Co. has Co.-operated stores in the U.S, Canada, Japan, Italy, China, Taiwan, and Mexico. Co. also has franchise agreements with unaffiliated franchisees to operate Old Navy, Gap, Banana Republic, and Athleta stores throughout Asia, Europe, Latin America, the Middle East, and Africa.
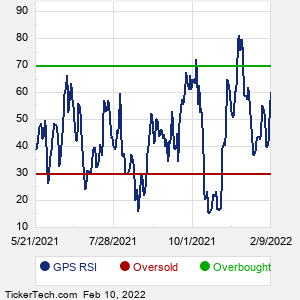
When researching a stock like Gap, many investors are the most familiar with Fundamental Analysis — looking at a company's balance sheet, earnings, revenues, and what's happening in that company's underlying business. Investors who use Fundamental Analysis to identify good stocks to buy or sell can also benefit from GPS Technical Analysis to help find a good entry or exit point. Technical Analysis is blind to the fundamentals and looks only at the trading data for GPS stock — the real life supply and demand for the stock over time — and examines that data in different ways. One of these ways is called the Relative Strength Index, or RSI. This popular indicator, originally developed in the 1970's by J. Welles Wilder, looks at a 14-day moving average of a stock's gains on its up days, versus its losses on its down days. The resulting GPS RSI is a value that measures momentum, oscillating between "oversold" and "overbought" on a scale of zero to 100. A reading below 30 is viewed to be oversold, which a bullish investor could look to as a sign that the selling is in the process of exhausting itself, and look for entry point opportunities. A reading above 70 is viewed to be overbought, which could indicate that a rally in progress is starting to get crowded with buyers. If the rally has been a long one, that could be a sign that a pullback is overdue. |