FLIR Systems designs, develops, markets, and distributes solutions that detect people, objects and substances that may not be perceived by human senses. Co.'s segments include: Industrial Technologies, which develops and manufactures thermal and visible-spectrum imaging camera cores and components that are utilized by third parties and other types of imaging systems; and Defense Technologies, which develops and manufactures imaging and recognition solutions for a variety of military, law enforcement, public safety, and other government customers for the protection of borders, troops, and public welfare.
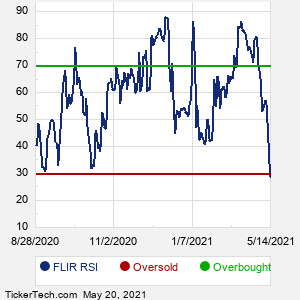
When researching a stock like FLIR Systems, many investors are the most familiar with Fundamental Analysis — looking at a company's balance sheet, earnings, revenues, and what's happening in that company's underlying business. Investors who use Fundamental Analysis to identify good stocks to buy or sell can also benefit from FLIR Technical Analysis to help find a good entry or exit point. Technical Analysis is blind to the fundamentals and looks only at the trading data for FLIR stock — the real life supply and demand for the stock over time — and examines that data in different ways. One of these ways is called the Relative Strength Index, or RSI. This popular indicator, originally developed in the 1970's by J. Welles Wilder, looks at a 14-day moving average of a stock's gains on its up days, versus its losses on its down days. The resulting FLIR RSI is a value that measures momentum, oscillating between "oversold" and "overbought" on a scale of zero to 100. A reading below 30 is viewed to be oversold, which a bullish investor could look to as a sign that the selling is in the process of exhausting itself, and look for entry point opportunities. A reading above 70 is viewed to be overbought, which could indicate that a rally in progress is starting to get crowded with buyers. If the rally has been a long one, that could be a sign that a pullback is overdue. |